
What is the breakout method — how to practice and how to deceive
Introduction
When I bought after seeing a breakout above a high price, it quickly returned to the original range. If you’ve ever tried a breakout, you may have experienced this at least once.
Breakouts are easy to understand in concept, but they are accompanied by movements called “false breaks.” This article summarizes the idea of breakouts and how to cultivate the ability to distinguish false breaks through practice.
What you will understand from this article
- What breakouts are and what a false breakout is
- Common situations where false breaks are said to occur
- A step-by-step guide to practicing distinguishing false breaks
What a Breakout Is
A breakout isthe moment when price breaks through the previous high/low or the upper/lower bound of a range (price movement width), and moves in the direction of the breakoutThis is the idea.
When price breaks a level that many people are watching, orders placed there tend to move, and price movement is believed to continue.
- If it breaks above the upper line, follow the upward movement
- If it breaks below the lower line, follow the downward movement
Whether a breakout has occurred is easy to determine by looking at the chart. Clarity is one of the good points of breakouts.
What a False Breakout Is
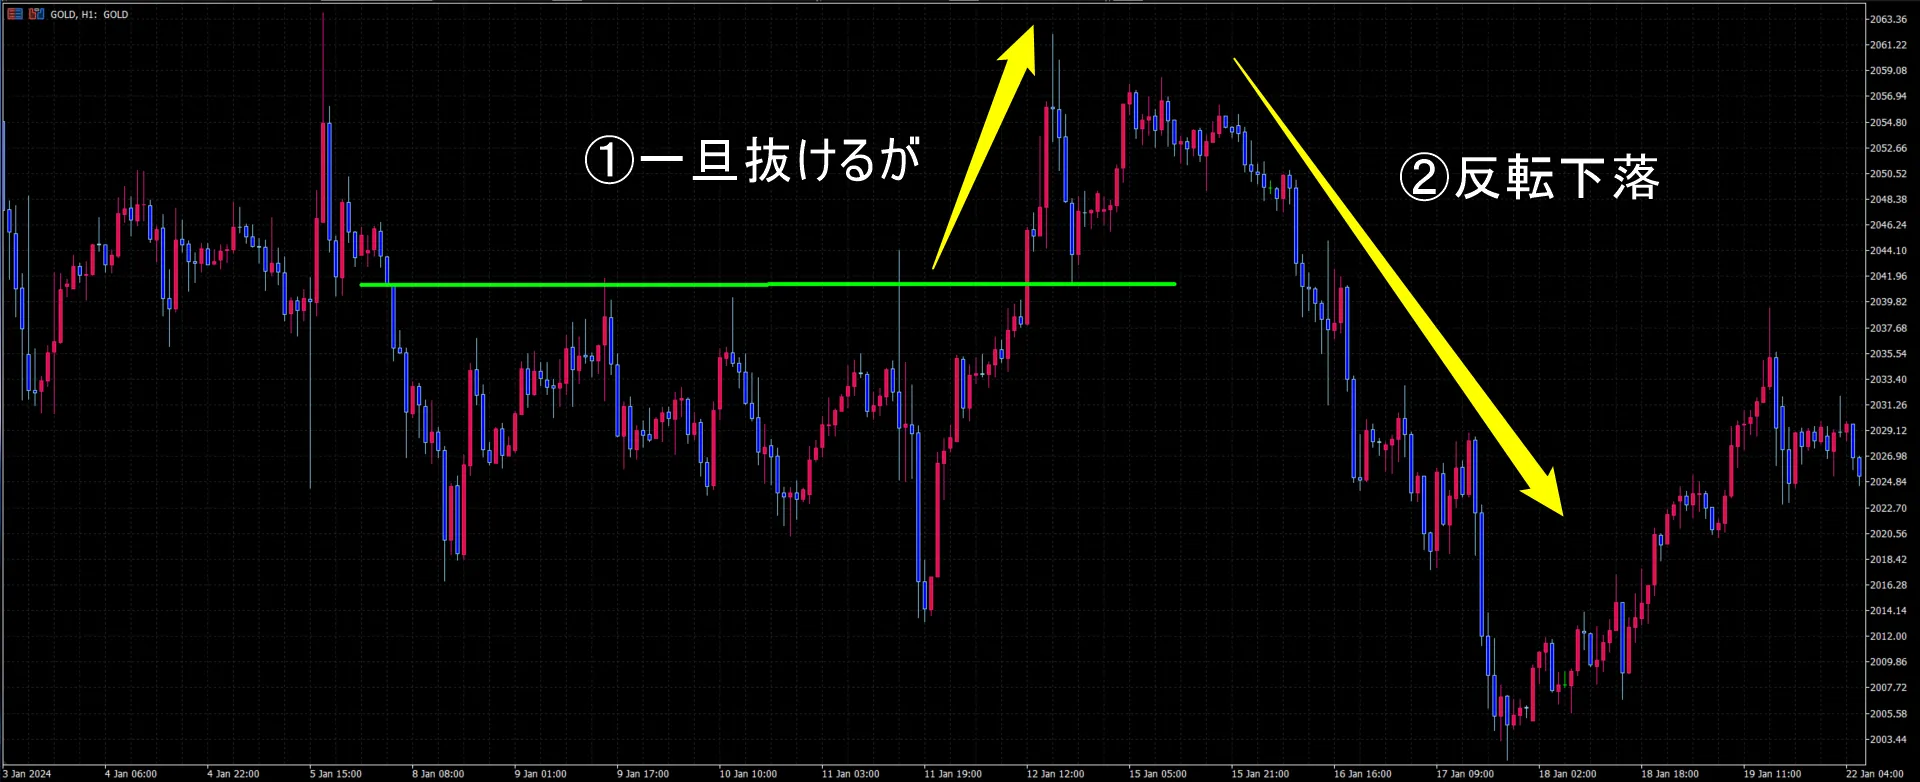
A false breakout (fake) isa movement that seems to have broken the line, but immediately returns to the original range.
If you get pulled in the direction of the breakout and are immediately returned, it becomes a loss cut. If false breaks persist, you may feel that “breakouts can’t be used.”
However, false breaks are also unavoidable in some aspects. At the moment of breakout, whether it will continue or revert is not yet decided.
Situations Where False Breakouts Are Said to Be Common
The following situations are often said to be prone to false breaks. None of these guarantee a false breakout will occur.Consider these as practice materialto verify them.
- Looking at a higher timeframe, you’re still before a major milestone: on the lower timeframe, a breakout may occur, but the high/low on the higher timeframe is just ahead
- Entered before the candle is confirmed: a brief breakout only by a wick, and the close remains inside the line
- Immediately after economic data releases: prices swing temporarily, making it easy to bounce around the line
- During periods of low price movement: there is little momentum, so even if it breaks, it’s unlikely to continue
False Breakouts Cannot Be Distinguished by Knowledge Alone
When you review past charts, false breaks can look easy to identify. This is becauseyou can see price movement after the breakout.
In actual markets, there is no answer at the moment of the breakout. Even if you know the common situations above, you can only judge on the spot whether the current situation matches them.
This judgment cannot be learned by reading knowledge alone.You can only cultivate it by seeing many situations where the future is unknown and comparing your forecast with the result.
Why seeing the future ruins practice is explained in detail in this article.
▶ Why predicting the future prevents practice — three situations where retrospective analysis includes hindsighthttps://www.gogojungle.co.jp/finance/navi/articles/126818
Steps to Practice Distinguishing False Breakouts
- Put your breakout rules into words: which line, on which time frame, and how to define an actual breakout (wick or close)
- Before entering, write your forecast and reason: whether it’s real or a false breakout. Reasons (upward time frame, time of day, candle shape, etc.)
- After observing the result, mark it with a yes/no: do not alter the forecast and reasons written earlier
- Increase the number of scenarios: observe many scenarios of the same rules on one currency pair
- Look for common points in false breakout scenarios: compare the position of the higher timeframe, time of day, and the shape of the breakout candle
If you practice by manually scrolling the chart, the price movement after the breakout will appear on the right side of the screen. If you look at the answer before writing your forecast, steps 2 and 3 won’t work.
Practice with Tools
The MT5 indicator “FX Past Verification Trainer” is a practice tool that plays back past charts one by one and allows you to place orders and record results in a simulated account.
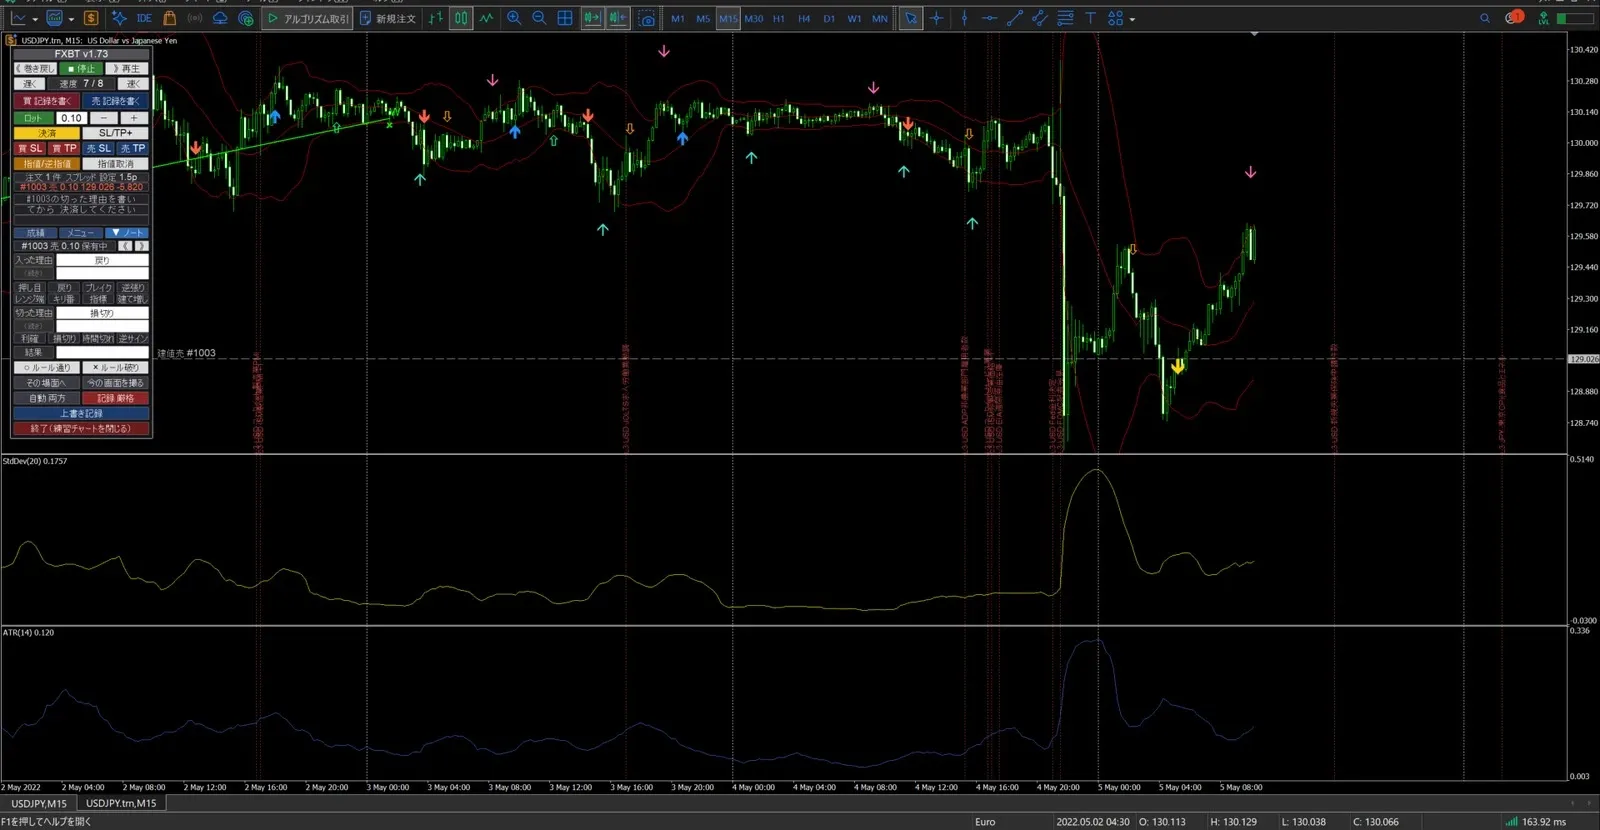
- Since future candles do not exist as data, you cannot see price movement after the breakout until playback
- At slower speeds, you advance one minute at a time,so you can watch the candle that breaks the line forming. You can also see the breakout and return with the wick right there
- You can place up to three higher-timeframe candles for the same currency pair side by side and move them at the same time. You can judge while watching the higher-timeframe milestones
- In the trade notes,you can write your forecast before entering. You can afterwards mark Yes/No for reflection
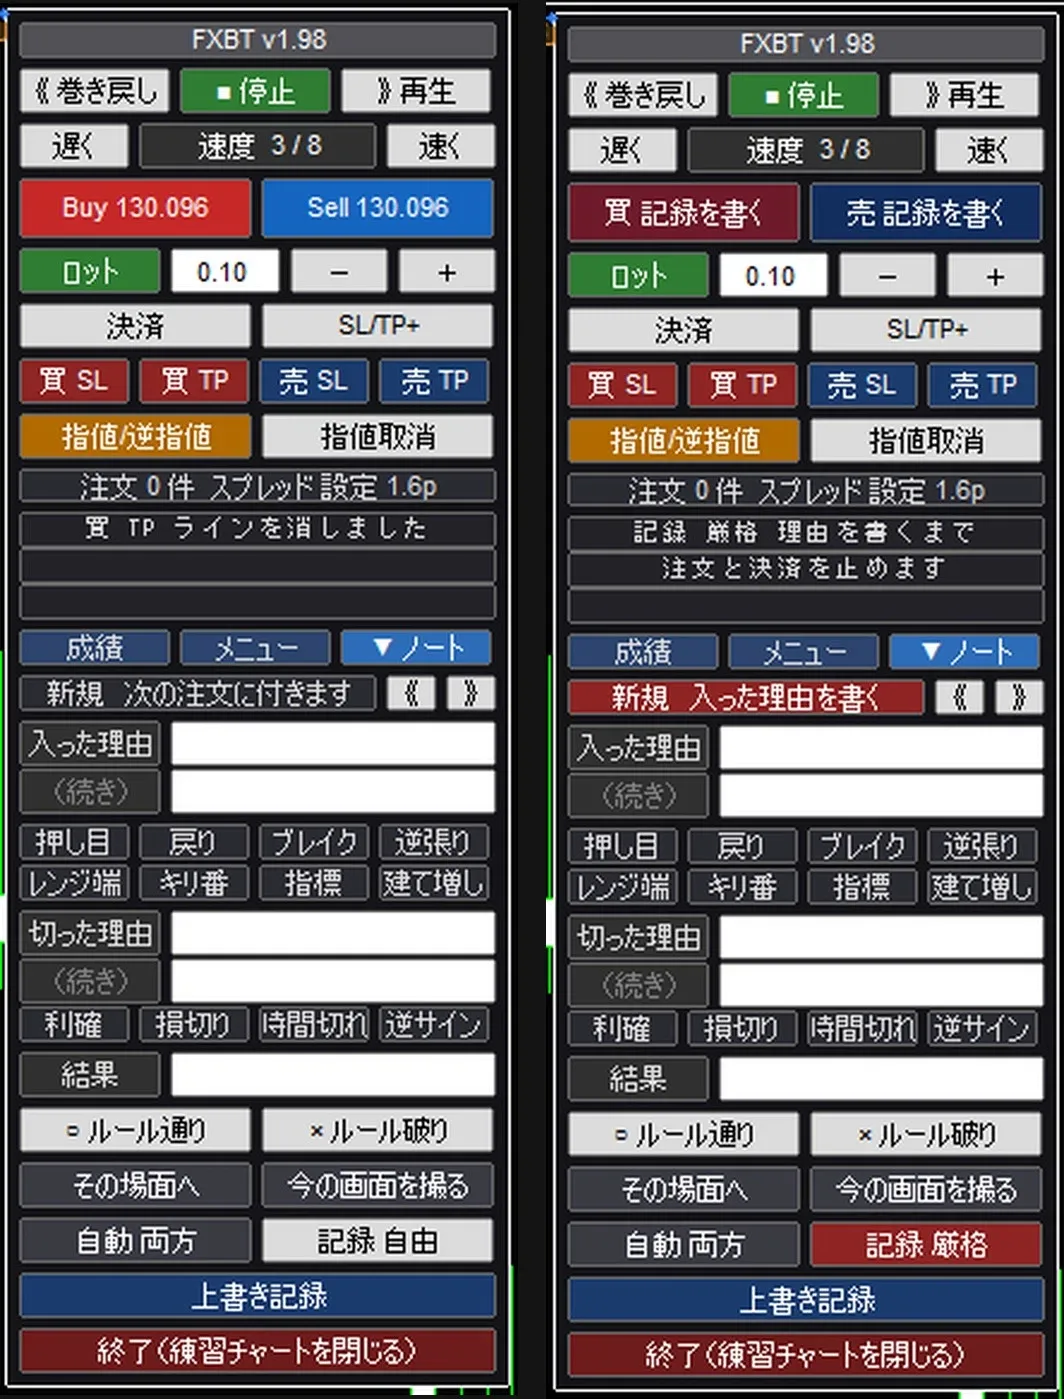
There are things you cannot do.
- Fees and swaps are not included in calculations. Price movements finer than the minimum candle you set (default is 1 minute) are not reproduced
- There is no feature that tells you whether it is a false breakout. Distinguishing is up to you
- Account currency is only Japanese Yen, and it supports MT5 (Windows) only
Instructions for practicing with this tool in MT5 are summarized in another article.
▶ How to practice past verification when you cannot see the future in MT5 — Pitfalls of manual scrolling and practice with one candle at a timehttps://www.gogojungle.co.jp/finance/navi/articles/126682
Summary
- Breakouts are the idea of entering in the direction of a breakout through high/low or range boundaries. False breaks are common
- False breaks cannot be distinguished at the moment of breakout. They look easy to identify when you review later because you can see the answer
- Put your rules into words, write your forecast and reason before entering, and practice with many unknown future scenarios
Related Articles
Seven commonly used discretionary trading approaches and the difficult parts and what to look for in practice.
▶ Summary of representative discretionary trading techniques — seven approaches and how to practice each
https://www.gogojungle.co.jp/finance/navi/articles/127390
A way of deciding the location of stop loss starting from where the reason for entry would break, and how to practice it.
▶ How to determine stop loss placement — place it at a well-founded level
https://www.gogojungle.co.jp/finance/navi/articles/127283
Waiting too long for a pullback, or waiting too early, and how to practice “how far to wait.”
▶ Bullish on pullbacks and reversals — practice on how far to push
https://www.gogojungle.co.jp/finance/navi/articles/127183
About the Practice Tools
The practice described in this article can be done with the MT5 indicator “FX Past Verification Trainer.” It is a practice tool that plays back past charts one by one, enabling orders, recording, and reflection in a simulated account.
There is a 7-day trial version.You can try all features without restrictions for 7 days.
First, check whether it runs on your MT5 and whether your usual indicators work.
▶ Trial version (Product ID 87387)
https://www.gogojungle.co.jp/tools/indicators/87387
If you want to continue practicing, please refer to the full version.
Notes traded in the trial can be opened in the full version as is.
▶ Full version (Product ID 86765)
https://www.gogojungle.co.jp/tools/indicators/86765
Important Notes
- This tool is for practice. It does not guarantee profits. It does not execute real orders.
- This article introduces practice methods. It does not promote specific buying/selling or strategies.