

Using statistical methods (correlation analysis), an EA created by finding the optimal combination from over 400 technical indicators and logics
1. Overview
When developing an EA, you combine multiple technical indicators and logics,
and you often cannot determine which combination is most effective, so you create an EA and backtest it,
if it doesn’t go well you change the combination and recreate it—this trial-and-error method has been used traditionally.
With this approach, it takes a long time to obtain a good EA.
Therefore, we considered a method to migrate data obtained in MT4 to Excel, which has a rich set of statistical functions, and to develop logic using statistical methods
(correlation analysis), and we would like to introduce it.
2. Normal method for creating an EA
• Load several indicators onto the chart and, while looking at the chart,
determine entry and exit points by considering crosses, arrows, levels, etc.
• Drawbacks of the traditional method
① It often only works well during a certain period (the period you checked the chart).
② It does not yield stable profits over a long period, and the profit curve does not show a clean upward-right slope.
③ It takes time to complete.
3. EA creation method using EXCEL correlation analysis
<Steps>
① Create a simple EA with a high trading frequency
② Use backtests to collect entry times (basic data)
③ Collect more than 200 types of technical data at the entry times
④ Migrate to EXCEL, perform correlation analysis with profit, and determine the optimal filter.
⑤ Apply the optimal filter to the EA from step ①
⑥ If there is no good filter, change the technical data from step ③.
4. Basic data collection (1)
We will create an EA to collect basic data.
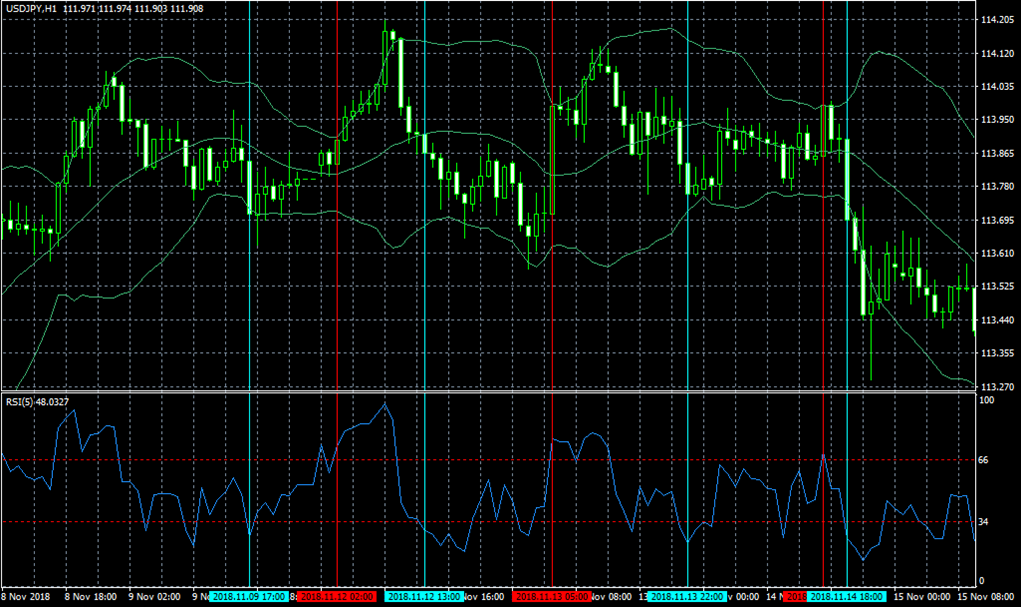
(Example)
・Buy entry,
When the long-term moving average indicates an uptrend,
When RSI is below a certain value,
・Exit from buy position
When it hits the upper band of the Bollinger Bands
・As much as possible, more trading frequency is desirable.
・No hedging, maximum position preferably 1.
5. Basic data collection (2)
From the backtest of the created EA, derive the entry times and profit/loss data
6. Collection of technical data
Collect the technical data at the entry time of the basic data.
<Example of technical data>
・Deviation of the upper moving average from the past tens of hours
・Width of Bollinger Bands, slope of the upper band, slope of the lower band, expansion
・Stochastic, MACD (difference between main and signal, slope of main)
・High/low (range, difference from current price)
・Higher high and higher low by Zigzag
・Body length of bullish and bearish candles
・Upper shadow, lower shadow
Store more than 200 types of data across multiple timeframes and periods in a CSV file
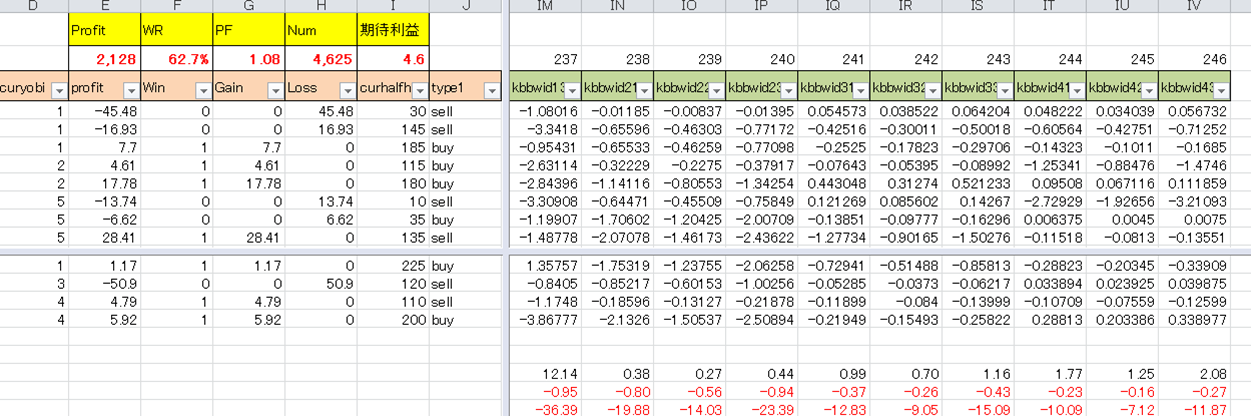
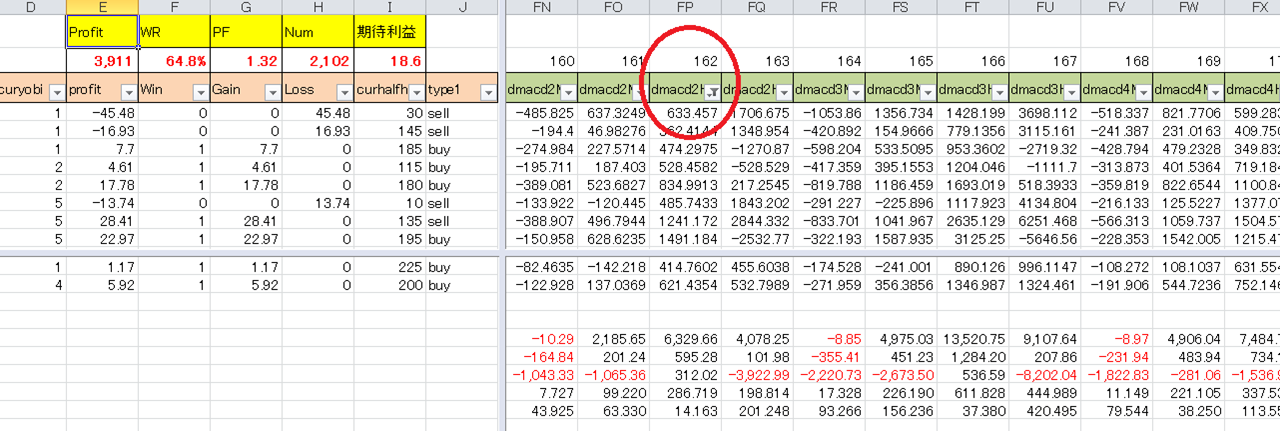
7. Migration to EXCEL
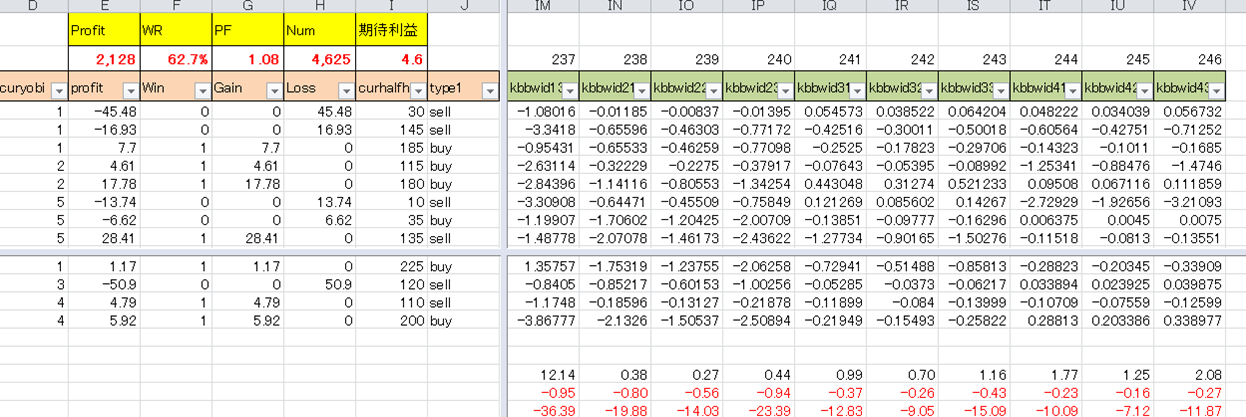
8. Correlation analysis
In Excel's data analysis, compute the correlation coefficient relative to profit.
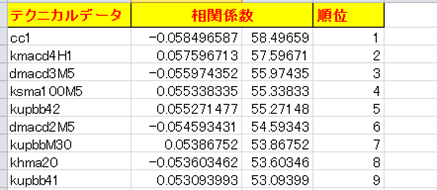
9. Determination of optimal values by VBA
Use VBA to vary more than 200 highly correlated data items to obtain optimal values.
When optimizing parameters,
10. Embedding into EA
The following improvements were achieved.
Profit: 2,203 --> 3,886
P/F: 1.08 --> 1.31
Trades: 4,631 --> 2,173
Maximum drawdown: 601 --> 377
Win rate: 62.9% --> 64.8%
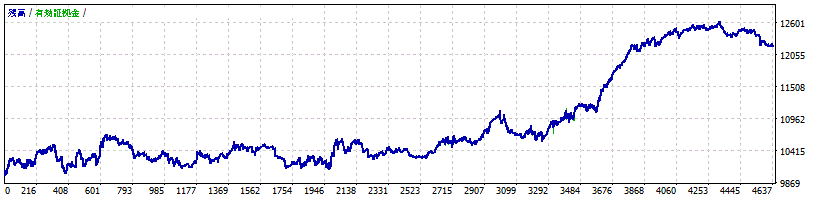
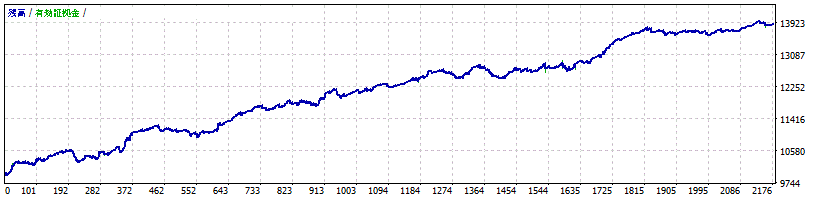
11. Improved asset curve
• Before improvement
• After improvement
12. EAs developed with this method
Senji Banben
https://www.gogojungle.co.jp/systemtrade/fx/14944
Yamashi Suimei
https://www.gogojungle.co.jp/systemtrade/fx/15576
Kae Kurenyan Ryoku
https://www.gogojungle.co.jp/systemtrade/fx/17258