

How to master large bullish candles and large bearish candles to quickly and accurately ride the trend

This article is 【How to master bullish and bearish candles in FX to ride the trend quickly and accurately】 with a detailed explanation. |
Therefore, price action signals using candlesticks offer a very wide range of usable options.
What is price action By observing the price movement of candlesticks, identifying patterns, characteristics, and directions within, professional traders focus on price action analysis as a method to forecast future price moves. When combined with indicators or your own methods, there are several price action patterns that become exceptionally effective. For carefully selected price action patterns, please refer to【Win with Candlestick Price Action! FX’s 7 Best Signals – Definitive Guide】for a detailed explanation. |
Among price action patterns using candlesticks, engulfing bars (outside bars), inside bars, and pin bars are well-known, but there are other strong candlesticks as well.
That is the single candlestick that can reveal direction: the bullish candle and the bearish candle.
However, it is surprisingly rare to find explanations that go into the usage in detail.
This article will explain in detail
・The correct definitions of bullish and bearish candles
・Price action techniques: high-probability bullish and bearish candles
・Candlesticks you should not use
and other topics.
The most representative trading style is “trend following.”
In simple terms, “trend following” means
① recognizing the trend of whether to buy or sell
② buying on dips at resistance (or selling on rallies at support)
However,if you cannot recognize the trend (step ①), you cannot profit with this trading style.
In other words, you need a tool to measure the trend, and
actually,you can identify the trend by using bullish and bearish candles.
Once you master using bullish and bearish candles, you can notice reversals earlier than others and ride early trends.
Now, let’s dive in.
Representative candlesticks for trend continuation (definitions of bullish and bearish candles)
The representative candlesticks showing trend continuation are the “bullish candle” and “bearish candle.”
Both bullish and bearish candles visually convey momentum to anyone who looks at them.
Definition of bullish candle
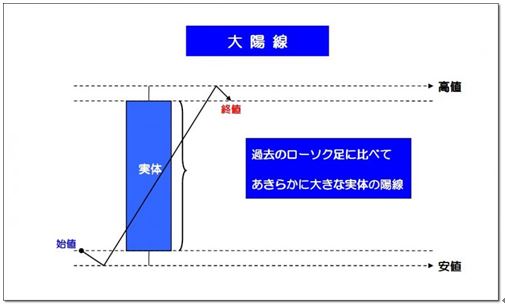
A bullish candle with a body larger than previous candles.
(Preferably with little or no upper shadow.)
A bullish candle cannot be judged by a single candlestick, so check on the chart.
The most important point in the definition of a bullish candle is that its body is clearly larger than past candles.
The appearance of a bullish candle signaled a shift to an upward trend.
Definition of bearish candle
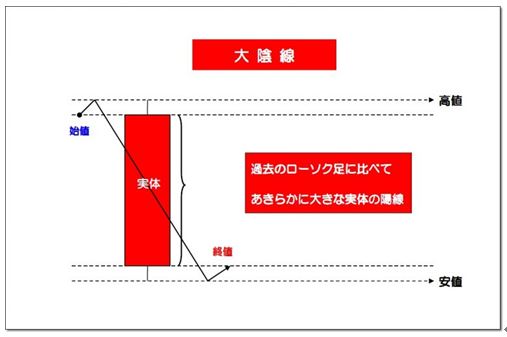
A bearish candle with a body larger than past candles.
(Preferably with little or no lower shadow.)
Like bullish candles, bearish candles cannot be judged by a single candlestick, so check the chart.
The key is that the body is clearly larger than past candles.
The appearance of a bearish candle signals a shift to a downward trend.
High-probability bullish and bearish candles that can be used in FX
“Bullish and bearish candles” alone can show strong momentum, but that does not yet confirm the trend.
Next, four patterns will be introduced to delve further into the topic of “bullish and bearish candles.”
① Outside bar (engulfing)
② Fake setup
③ False breakout
④ Reversal from support/resistance
① Outside bar (engulfing)
Not only the bullish and bearish candles by themselves, but the candlestick combinations should be confirmed to improve analysis accuracy.
In particular,the combination of bullish and bearish candles that is most user-friendly is the outside bar (engulfing).
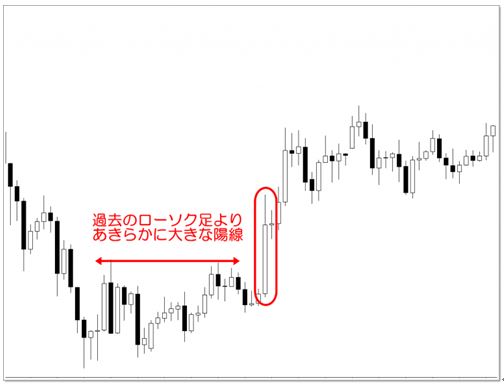
Let's check with an image.
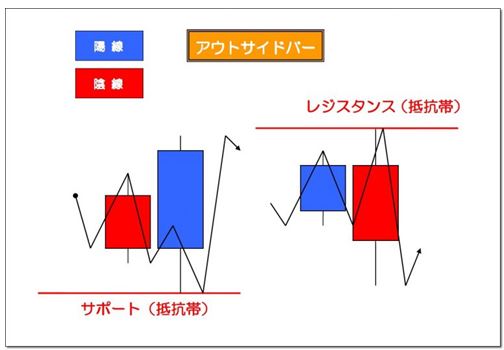
Rather than jumping in with only bullish or bearish candles, if an outside bar occurs simultaneously, accuracy increases considerably.
(※Details are explained in【Completely master engulfing and harami patterns! Reversal candle signals that professionals never miss】)
② Fake setup
Next, we introduce a high-probability bullish and bearish candle pattern: the ‘fake setup.’
This is an advanced use of the outside bar, but it is important, so keep it in mind.
Definition of fake setup
‘Fake’ means ‘deception’.
When a range breakout ends in a fake-out, the price movement accelerates in the opposite direction—this phenomenon is called a fake setup.
When bullish and bearish candles accompany this phenomenon, the accuracy rises significantly.
Check on the chart.
Fake setups often involve not only bullish and bearish candles but also spike-like candles such as pin bars.
(※Details are explained in【FX Pin Bar Techniques You Can Use: Definitions of Powerful Candlestick Reversal Signals】)
Fake setups have a high probability of price moving in the direction indicated by the candlesticks!
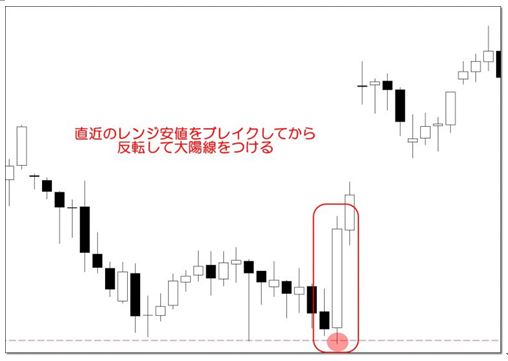
③ False breakout
Definition of false breakout
‘False’ means ‘mistake or counterfeit’.
A breakout of past highs or lows that fails and price accelerates in the opposite direction
False breakouts resemble fake setups, but carry slightly different implications.
Fake setups involve a false move within the most recent price action, whereas false breakouts are false breakouts of past highs or lows.
Therefore, on charts where a false breakout can be confirmed, there is no clear visible support/resistance.
Now, let's confirm with a chart.
First, look at a 4-hour chart.
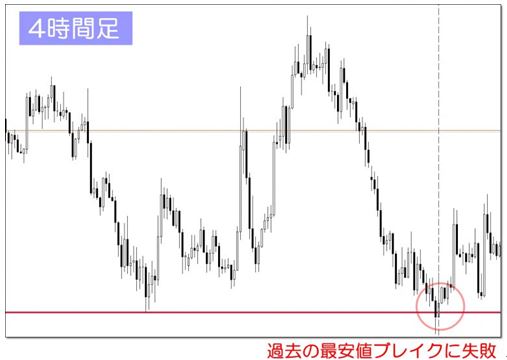
The red circled area shows trying to break the lowest price.
If you drop this to an hourly chart,
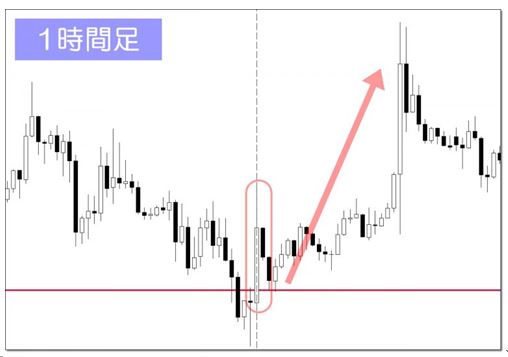
how does it look?
A bullish candle that negates the break of the lowest price is clearly visible.
Naturally, price then moves upward.
False breakout is a false move of the highest/lowest price (counter-trend).
It can be a bit difficult, so beginners may skip trading this.
Even if you do not trade, simply understanding this price action perspective will indicate more advanced analysis.
④ Reversal from support/resistance
This is textbook trading.
Support/Resistance + bullish (or bearish) candle
Not only the bullish candle but the tool that forms a basis for the trade is support/resistance.
Check on the chart.
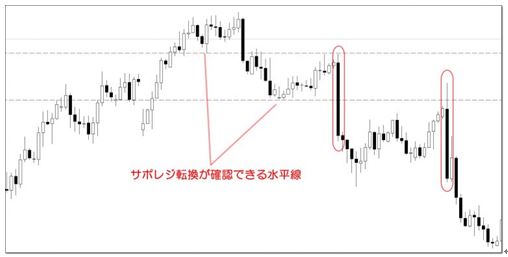
As you can see on the chart, even with the same bullish and bearish candles, sometimes support/resistance is present and sometimes not, resulting in a huge difference in accuracy.
This is very simple, but observing candlestick reactions against this support/resistance is a fundamental of price action, so don’t miss it.
Regarding the right-side bearish candle,
the combination of support/resistance + outside bar + bearish candle is a powerful signal.
If you can view it this way, you can confidently ride the downside movement.
So far, four high-probability bullish and bearish candles have been explained, but there are many more appearances of bullish and bearish candles on charts.
However, not all bullish and bearish candles indicate the trend (direction).
In the next section,I will explain bullish and bearish candles that do not indicate a trend (direction).
Three cautions for bullish and bearish candles
Powerful, large candles provide clear signals for trading.
However, not every bullish or bearish candle will indicate the future trend.
In fact, some may reverse afterward.
Be mindful of the following three points to identify candles that indicate the trend.
① Be careful with long-upper-wick and long-lower-wick candles
Caution point ① is the candle shape.
Be cautious of bullish candles with long upper wicks and bearish candles with long lower wicks.
The basic interpretation is that wicks indicate uncertainty, while the body reflects the true valuation and facts.
(For details, see 【Knowing how to read candlesticks makes you a pro in analysis】)
Thus, a bullish candle with a long upper wick confirms strong buying pressure upward, but also shows uncertainty.
The same applies to a bearish candle with a long lower wick: strong selling pressure exists, but there is also uncertainty.
Check on the chart.
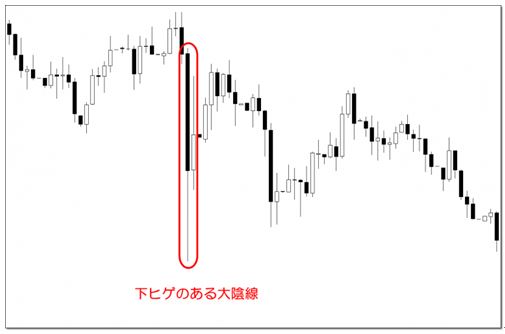
You can see a clearly large bearish candle compared to past candles, but the lower wick is also large, right?
Afterward, a downward trend did not occur; it became a range-bound market.
Even if the body is large, a long wick necessitates caution.
When such candles appear with wicks, avoid jumping in hastily.
Reconfirm whether there are other rebound factors.
Caution point ② is the presence of a climax.
In the trading world, there is the concept of a climax.
In English, “buying climax” and “selling climax” are used.
Buying climax
Selling climax
Supplements: What is a climax?
Supplement|What is a climax? Triggered by fundamental external factors, when buying leads to a parabolic rise, it is a ‘Buying Climax’ when selling leads to a parabolic drop, it is a ‘Selling Climax’ |
Though the term sounds appealing, the actual meaning and usage of climaxes in trading differs.
If a buying climax occurs, demand surges and prices spike dramatically.
In time, the overbought currency has no buyers left…
What follows is profit-taking selling pressure and a sharp price decline.
In short, buying climaxes are signals not to buy.
Selling climaxes are the opposite.
Institutions may push prices to attract retail traders at the highest or lowest points. This climax is when bullish and bearish candles appear.
Now, let's check with a chart.
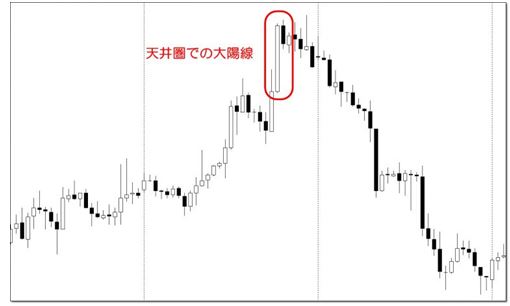
After the final climax, a sharp decline occurs immediately.
This is precisely the point that many novice individual traders fall into the trap of buying at the top.
As a countermeasure, avoid entering on bullish or bearish candles in the late waves of a swing (e.g., wave 5).
Do your best to not miss the early bullish and bearish candles.
③ Beware of candles that stop exactly at support/resistance
First, look at the image.
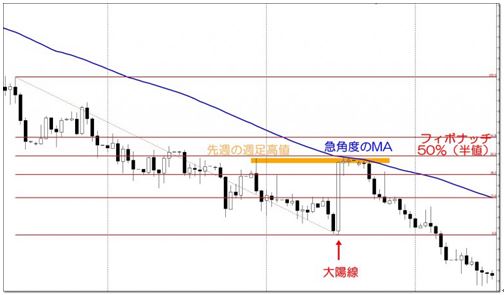
Can you spot the bullish candle?
A strong, expeditious bullish candle with no upper wick.
(In Sa打ta five-ways terms, this is called a “sunny body” candle.)
Of course, as a standalone candle it suggests upside, but it actually reverses.
Why is that?
As you can see, there are several resistance factors such as
・angled moving averages
・Fibonacci 50%
・last week's high
That abundance of resistance caused the reversal.
“A bullish candle or bearish candle ending exactly at support/resistance and closing there”
This pattern is something to watch carefully!
Moreover, candles ending near support/resistance are a common phenomenon.
In this pattern, bullish and bearish candles stop at support/resistance and close there.
‘Aike’s FX Blog’provides clear explanations of the knowledge and skills needed to win.
Summary
Finally, a recap of the essential points.
【High-probability bullish and bearish candles】
Outside bar
Fake setup
False breakout
Combination with support/resistance
【Candles to be cautious with】
Candles with long wicks
Climax
Stalling at support/resistance
Please apply these to your future trades.