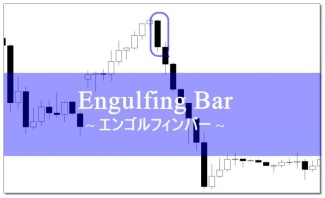

A combination of candlesticks showing strong reversal: "Bullish Engulfing/Inside Bar" and "Haramisashi (Harami) / Outside Bar"

This article explains in detail the concepts of『What is an Outside Bar (engulfing) and an Inside Bar (harami) in FX? A Complete攻略! The candlestick reversal signals that professionals never miss!. |
The combinations of ‘engulfing’ and ‘harami’ are among the most representative candlestick patterns, so no successful trader ignores these patterns.
Mastering them will help you achieve smaller losses and larger profits than ever before.
This article not only defines engulfing and harami correctly but also
・ the proper entry methods
・ entry points where you can enter and where you cannot
・ applications of engulfing and harami
, and explains them in detail.
I hope it helps improve your trading level.
Candlestick price action provides the fastest entries with minimal risk and maximum profit
In price action using candlesticks, a very well-known reversal pattern is the “Pin Bar.”
Pin Bars are not only easy to understand but also indicate very strong reversal signals.
(For details,【FX Useful Pin Bar Method! Powerful Candlestick Reversal Signals】are explained.)
Similarly, two highly usable candlestick reversal signals are the engulfing and harami patterns.
Engulfing
Harami
From the image, you can see that the shortest-entry with minimal risk and maximal profit is achievable.
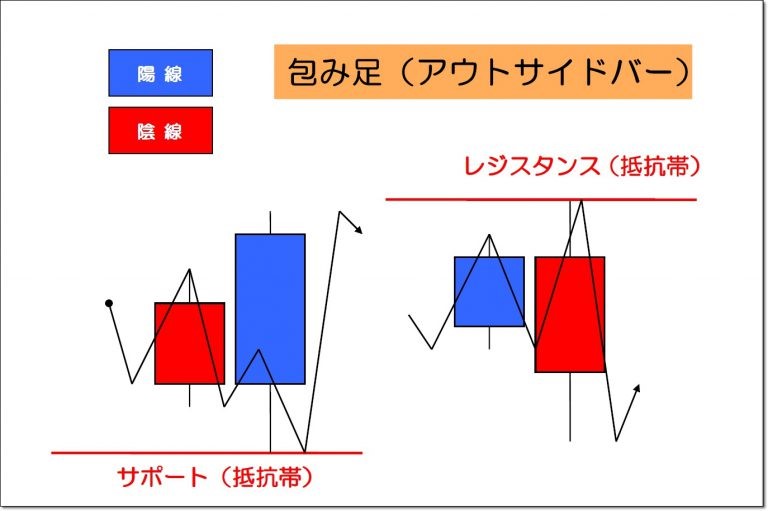
Engulfing (Outside Bar) definition and the basis for reversal (note)
Definition of Engulfing and Outside Bar
①The high/low of the first candle is completely engulfed by the high/low of the second candle.
②The second candle’s close completely surpasses the first candle’s high (or low).
Let's confirm with an image.
What makes engulfing reverse
In candlestick analysis, some people memorize pattern combinations or patterns themselves.
Of course, these patterns have an edge, so they can be used by memorization alone, but
“why can this candlestick combination be used?”—knowing the reason allows you to use candlesticks with more confidence.
Please re-check the engulfing (Outside Bar) image above.
The price movement is drawn on the candlesticks.
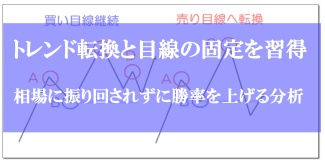
Yes, this characteristic movement is‘Dow Theory trend reversal’.
(※ For trend reversals,【How to identify trend reversal and continuation signals by breaking the prior swing low and prior swing high】explains in detail.)
Engulfing, when viewed on a lower time frame, is actually a trend reversal signal.
Let’s verify.
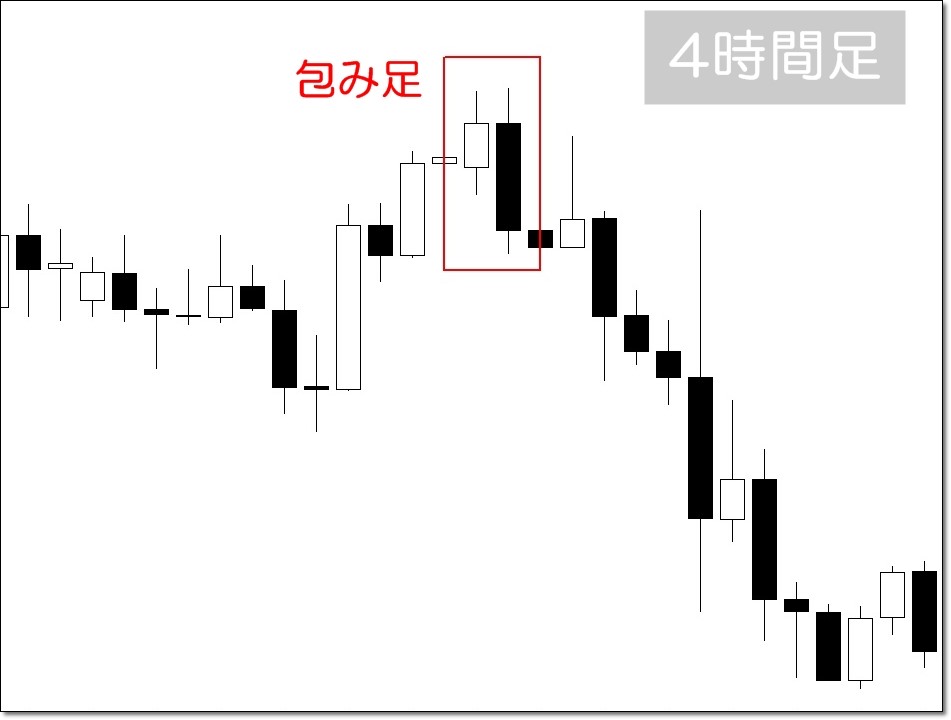
In the above figure, engulfing is a four-hour candle.
If you drop the time frame to a 15-minute chart to confirm...
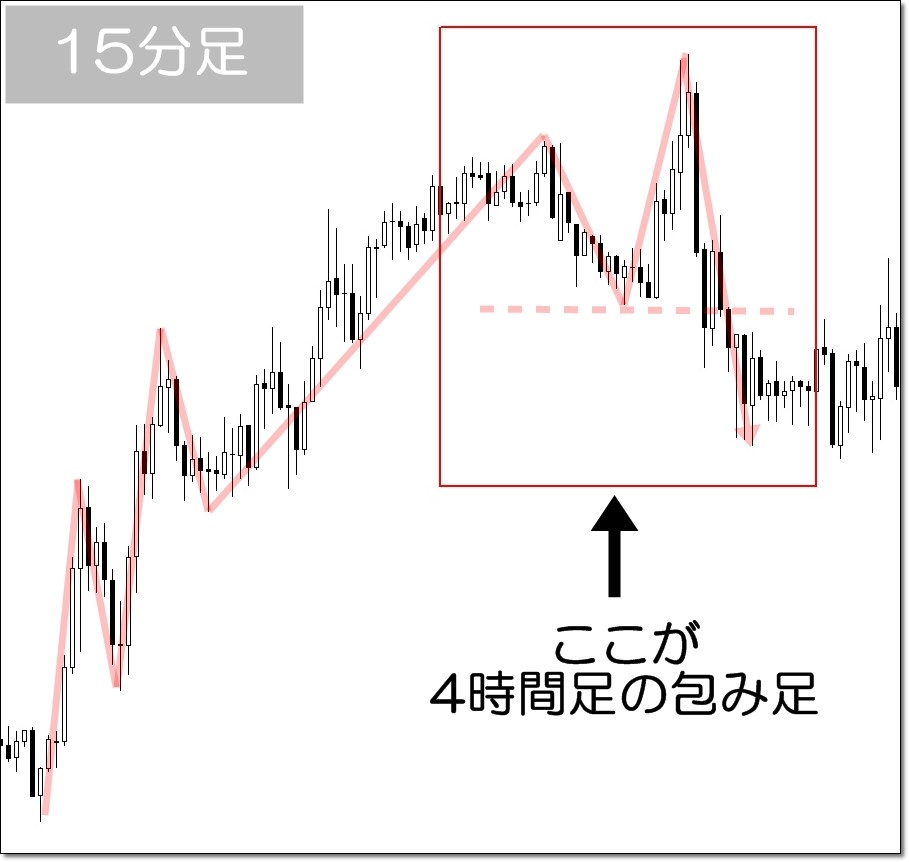
the trend reversal is complete.
Traders who use engulfing somewhat casually and those who truly understand the reason behind engulfing are on a different level.
In candlestick trading, the final difference comes from understanding the basis of such price movements.
Harami (Inside Bar) definition and basis for reversal (note)
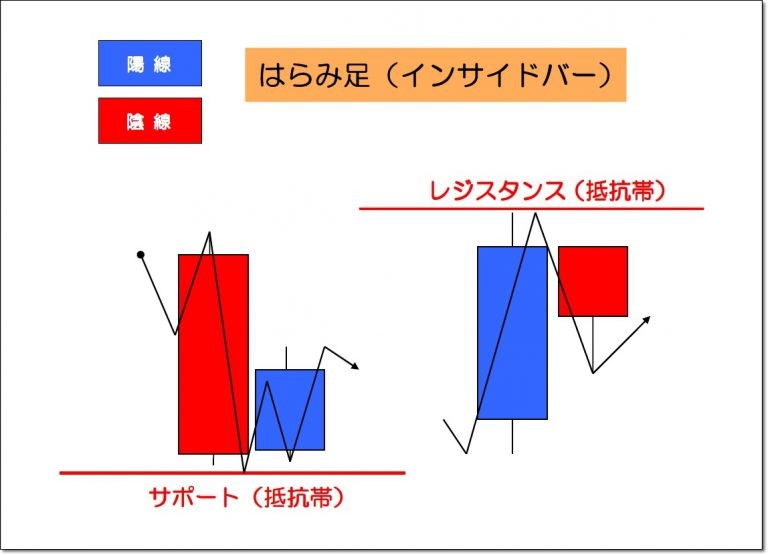
Definition of Harami and Inside Bar
Let's check with an image.
Harami is a candlestick combination that does not confirm reversal
The big difference from engulfing is that harami is more prone to false signals if you do not understand price movement.
Because harami is a candlestick combination that foreshadows reversal, but reversal is not yet confirmed.
Please look again at the harami explanation image above.
The price movement follows along the candlesticks.
Although it looks like it might reverse, it has not broken important support or resistance yet, so no trend reversal has occurred.
Sometimes the trend continues without reversing afterward.
(※ If you do not understand trend reversal,【How to determine trend reversal and continuation signals by updating the support and resistance lows and highs】explains in detail, so please refer to it.)
Let’s check the details in the images.
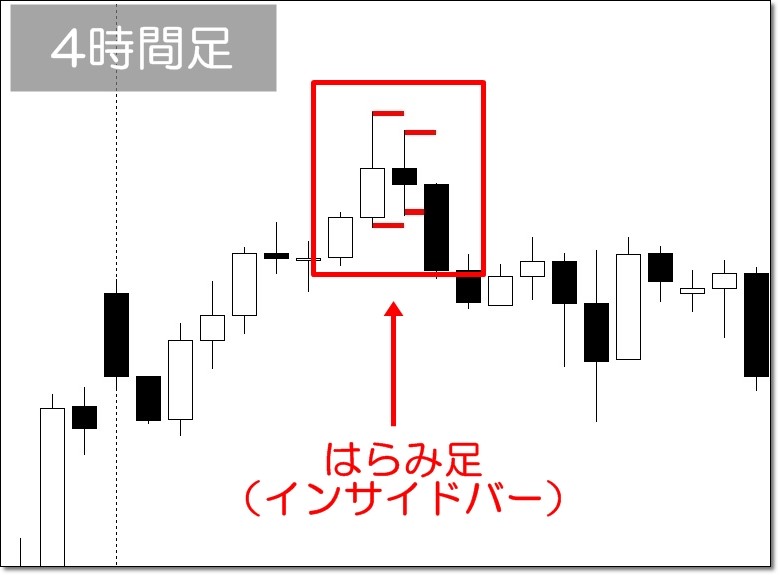
The above figure shows a four-hour harami.
To make it clear, red markers were placed on the highs and lows of the two candles.
If you drop this engulfing to a 15-minute chart and confirm...
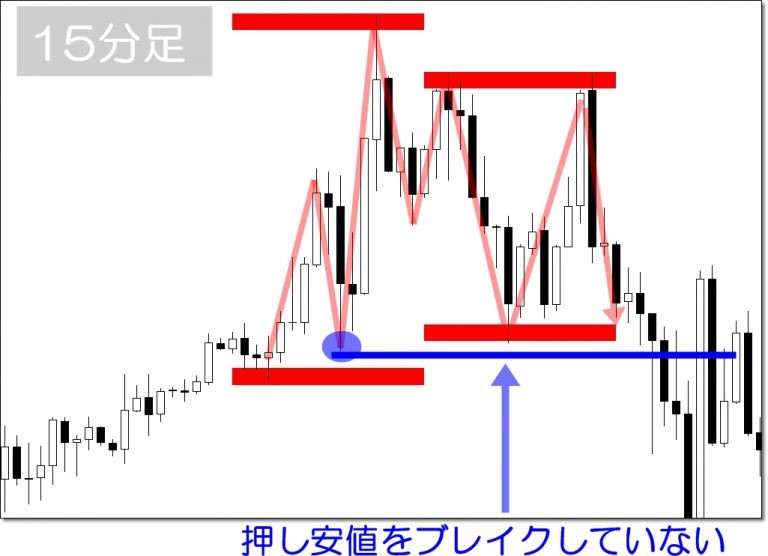
Harami indicates price movement is contracting and in a consolidation state.
In other words,when a harami is visible in the high or low zones with contraction, it foreshadows a reversal.
This is an important point, so let me reinforce it again.
Even if harami is confirmed, it does not mean reversal is certain; it is a signal indicating a possible reversal.
Entry methods for engulfing and harami
Engulfing and harami indicate reversals as candlestick combinations, but although they are similar, they have distinct features.
Therefore, there are slight differences in entry methods.
(To explain the entry methods, I’d like you to again view the images of the [4-hour chart] and [confirm on 4-hour chart with 15-minute chart].)
Engulfing entry method
Since engulfing confirms a trend reversal, you can enter by market order after confirming engulfing.
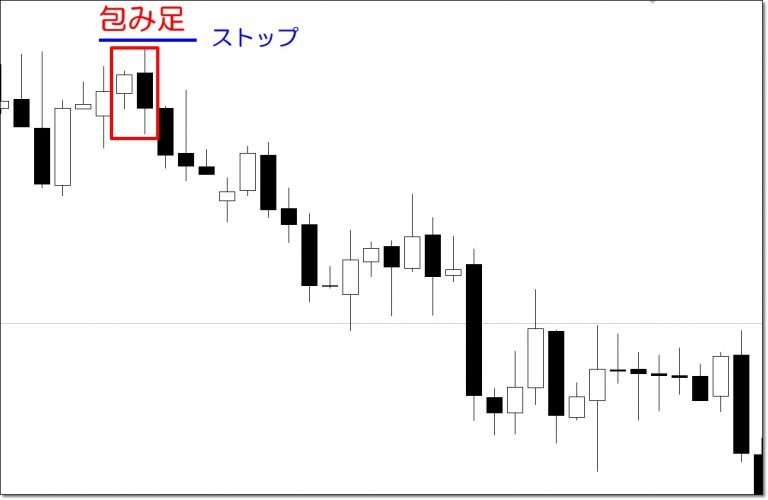
However, candlestick-based entry methods typically involve breaking the high/low of the candlestick, so a better method is to enter after breaking the engulfing high (or low).
Here is an illustration.
After confirming engulfing, enter market order
・Enter when the second candle’s high (or low) is broken
Harami entry method
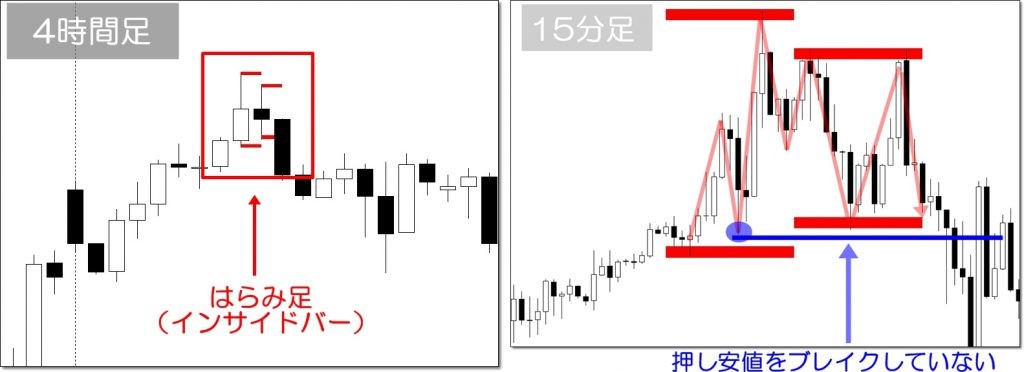
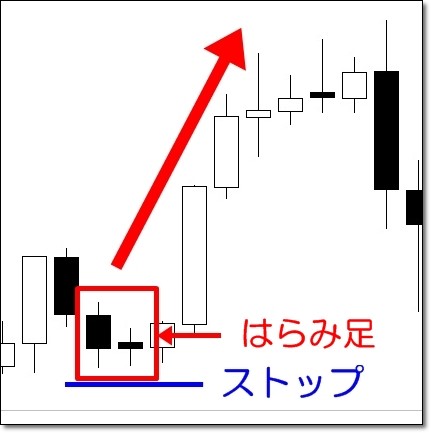
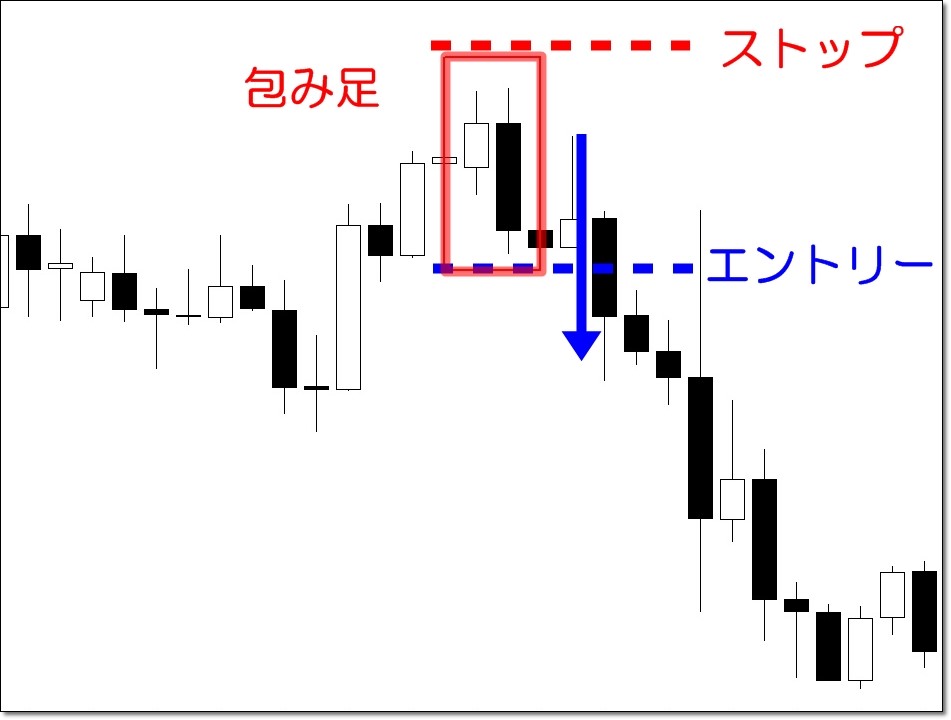
Harami is a sign of potential reversal, not a confirmed reversal, so the point where the trend reversal is confirmed becomes the harami entry point.
Let's check with an image.
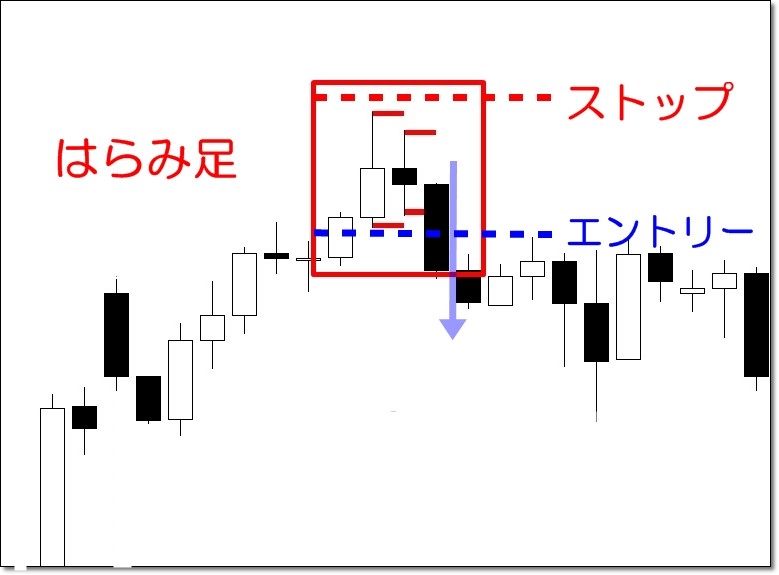
・After confirming harami, enter at the point where the first candle’s high (or low) is broken
Next, we will explain where to enter.
Entry points must be at reversal points
Engulfing and harami are candlestick combinations that indicate reversals, so
entry points are points where reversals are expected.
・Rebound at support/resistance
・Break of support/resistance
・Rebound of moving averages (MA)
Carefully Selected Candlestick Reversal Signals
Engulfing (Outside Bar) and Harami (Inside Bar) are price-action methods using candlesticks. Other price-action reversal patterns exist that work superbly when combined with indicators or your own methods. For carefully selected price-action patterns, see [Win with Candlesticks Price Action! FX Best 7 Signals [Permanent Version]] for details. |
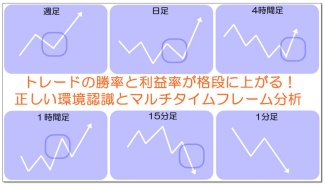
Multiple-timeframe Engulfing (Outside Bar) and Harami (Inside Bar)
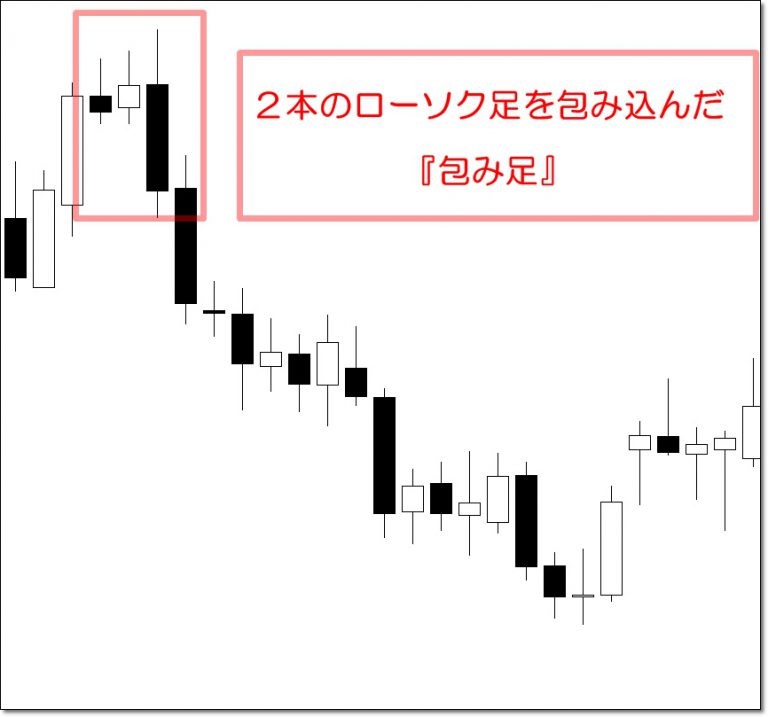
Finally, we will discuss the applications of engulfing and harami across multiple candles.
Up to now, engulfing and harami were described as two-candle patterns.
In actual charts, there exist patterns such as “engulfing that engulfs two candles” or “harami with three candles inside the first candle,” i.e., multi-candle interactions of engulfing and harami.
Price action involving multiple candles often produces large price moves due to the energy release.
Even though multiple candles are involved, the basic concepts and entry methods remain the same.
Let's check with images.
‘Engulfing that engulfs two candles’
‘Harami with three candles inside the first candle’
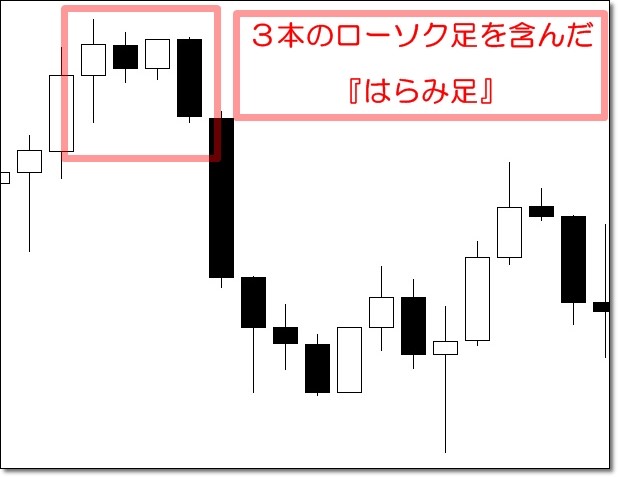
Engulfing indicates consolidation and breakout. Harami indicates consolidation.
The entry method and stop placement follow the same steps as the two-candle engulfing/harami.
5types of price-action patterns detected with high precisionMT4Indicator
⇒ MT4 Price Action Indicator! The long-awaited candlestick detection tool |
Summary
We have explained engulging/harami and Outside/Inside bars, but
in FX, it is generally more practical to adopt the definitions of Outside and Inside bars.
This is because, compared with futures and stocks, FX has higher liquidity and the price gaps are less common.
Moreover, it is important not to memorize patterns blindly, but to understand the reasons and evidence for price movements that lead to reversals.
Even reading this article should give you a deep understanding of candlesticks.
What we covered here were engulfing and harami; once you understand candlestick movements, you can apply these concepts to other patterns as well.
For other articles, please read