

Learn how professional traders read candlestick charts to boost your analytical skills!

This article 【Simply knowing how to read candlesticks can make you a pro-level analyst】 is explained in more detail in this article. |
You may have thought so.
In my amateur days, I totally underestimated candlesticks.
I knew the meaning of candlesticks, but I didn’t know how to use them.
Ironically, what dramatically helped me grow was not a winning method, but the “candlestick” itself.
The candlestick, drawn on the chart, is the world’s strongest analytical tool used by the most traders worldwide!
This article covers
・Why candlesticks are important
・Basic ways to read candlesticks and the mindset
・Advanced analysis methods and strategic thinking that professional traders always look at
を解説していきます。
Once you can read candlesticks, you won’t need to check numerous indicators to understand the current direction, and you’ll naturally develop the ability to formulate future strategies.
In fact, since I started doing price action analysis using candlesticks, indicators have gradually disappeared from my charts.
I hope this article helps improve your market analysis skills.
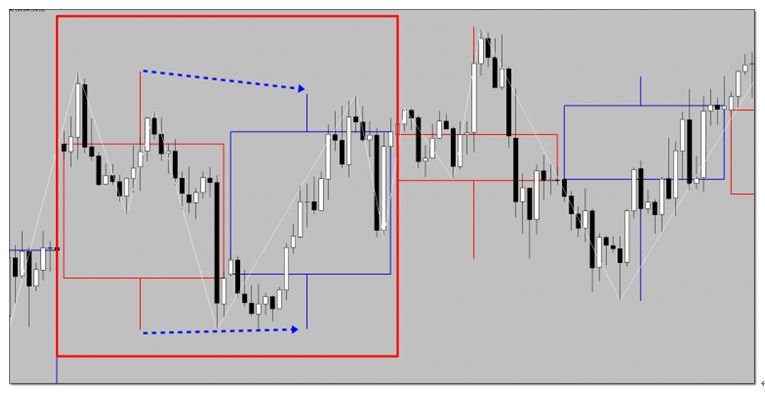
What is Price Action By looking at candlestick movements, identifying patterns, features, and direction, and predicting future price movements, professional traders focus on the analysis method known as “Price Action Analysis.” There are several Price Action patterns that, when combined with indicators or your own methods, show outstanding effects. For carefully selected Price Action patterns, please refer to[Win with Candlestick Price Action! FX’s 7 Strongest Signal Signals [Ultimate Guide]]which explains them in detail. |
Basic Ways to Read Candlesticks
First, understand the structure of candlesticks.
A single candlestick can provide a great deal of information.
So, what kind of information does it provide?
To answer that, let’s first explain the basic structure of candlesticks.
Please look at the image below.
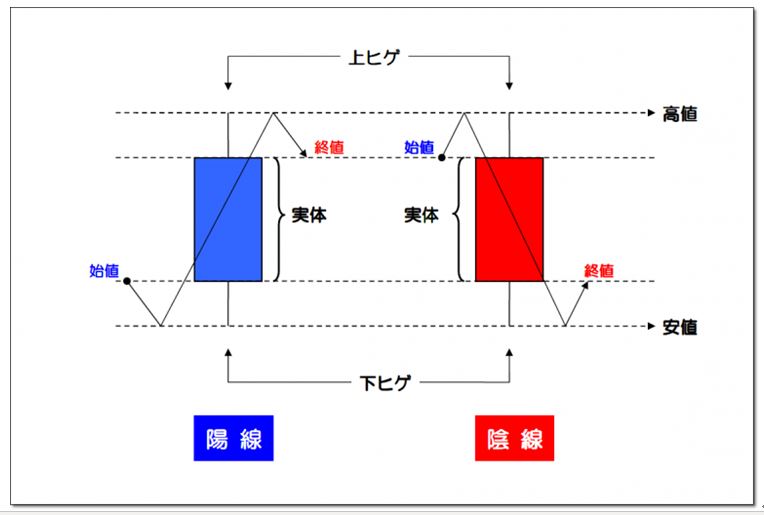
Surprisingly, a single candlestick conveys the following information.
① Four values “the four prices” (high, low, open, close)
② The two types of candlesticks indicating Buy or Sell
③ The wicks and the body representing uncertainty and fact
We will explain each one by one.
①【Four Prices】 High, Low, Open, Close
【Four Prices】
High: the highest price in a certain period
Low: the lowest price in a certain period
Open: the price at the start of the period
Close: the price at the end of the period
② Two Types of Candlesticks
【Bullish (Up) Candle】
If the close is higher than the open, a bullish candle forms.
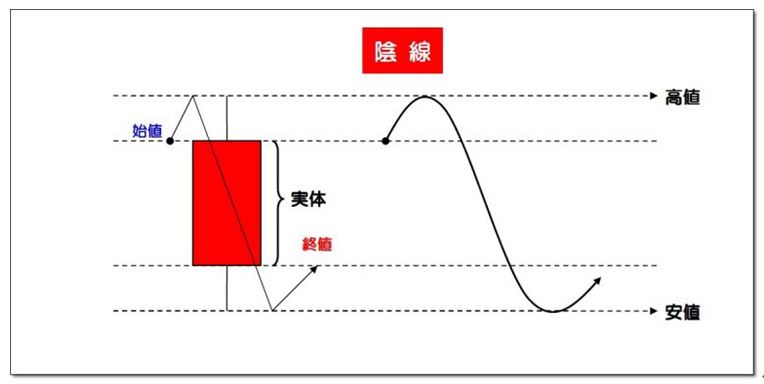
【Bearish (Down) Candle】
If the close is lower than the open, a bearish candle forms.
③ Wicks and Body
The last element is a very important factor when performing price action analysis.
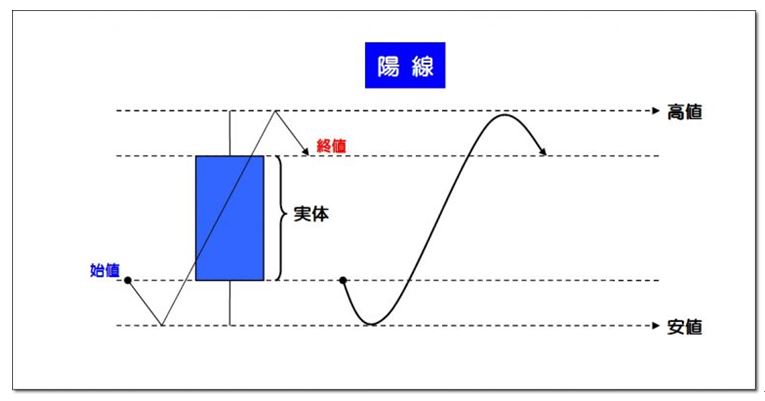
(1)【Body】
The body consists of the open and close, and expresses the difference with a single candle.
Look at the bullish candle below.

In this chart, the blue rectangle from open to close is the 【body】.
What about the next figure?

When the difference between open and close is small, you get a “small-bodied bullish candle” as shown above.
This indicates that there weren’t many buy orders (there were some).

When the difference between open and close is quite large, you get a “large-bodied bullish candle.”
This indicates that a lot of buy orders came in (a substantial amount of buying).
Thus, the body tells you what facts occurred within the candle’s period.
Keep the 【body】 in mind as we proceed to the explanation of the wicks.
(2)【Wicks】
【Wicks】 are formed by the high and the body’s high, and the low and the body’s low, represented by lines extending above or below the body.
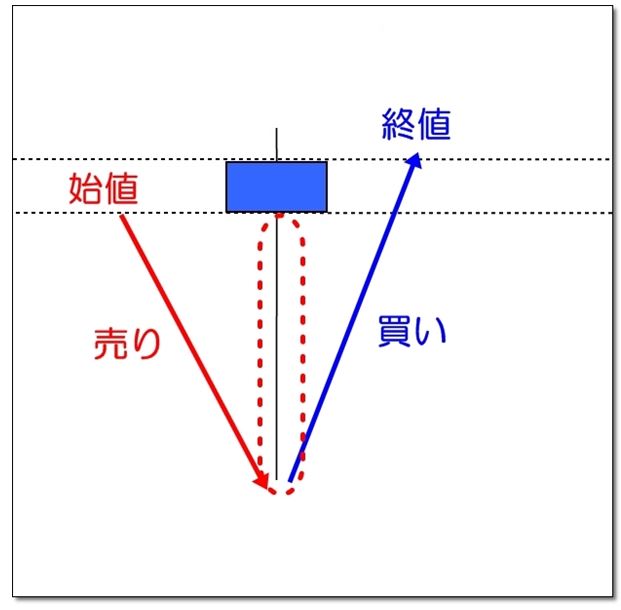
The red dotted frame is the 【wick】.
Now,the body has already told you multiple facts.
This【wick
In the above chart, the 【wick】 forms because
1. Open
2. Low
| | |
| | |
| | |
| | |
|


Is it OK?