
Unexpectedly Unknown! How to draw the correct trendline! What is the 5STEP rule?
This article is 【The Right Way to Draw Trend Lines — Wicks and Bodies? 5 Steps + α You Can Draw Unhesitatingly】 which provides a more detailed explanation. |
‘Trend lines used in chart analysis. Are you drawing them correctly?’
At least when I was a beginner, I could not draw trend lines correctly.
Because I did not know the correct way to draw them.
Yes,‘there are rules for how to draw trend lines’.
In this article, I will explain how to draw trend lines.
It is an easy and effective set of rules, so please refer to it.
★ Common mistakes with trend lines
‘I drew a trend line on the chart, but that line doesn’t work?’
That is‘a line that suits your convenience’.
‘A line that suits your own preferences’ is drawn without regard to any rules.
Unfortunately, such a subjective line is of no use to other traders at all.
Therefore, that line will not function.
“Is there a clear basis to draw a trend line there?”
“Aren’t you drawing it by feel?”
Two Types of Trend Lines
Here, we will explain the two types of trend lines.
An ascending trend line where price is rising to the right.
A descending trend line where price is falling to the right.
Now, let's check with actual images below.

【Ascending Trend Line】
When the rate is above the ascending trend line(candlesticks), look to buy in an uptrend.
【Descending Trend Line】
When the rate is below the descending trend line(candlesticks), look to sell in a downtrend.
Now, I will actually explain how to draw correct trend lines step by step.
Five Correct Ways to Draw Trend LinesSTEP
I will explain the method for drawing trend lines.
[STEP1] Connect two points by high highs (or two lows by lows) with a line
To draw a trend line,
Ascending trend: connect the low that starts the trend with a higher low than the starting point.
Descending trend: connect the high that starts the trend with a lower high than the starting point.
In other words, a trend line can be drawn if there are at least two extreme points (highs or lows).
Here is the key point: how you identify highs and lows matters.
If this judgment is wrong, you are likely to end up with a ‘line for convenience’ described above.
Therefore, to draw trend lines correctly, you must formalize rules for identifying accurate highs and lows.
In the following article, the method for recognizing highs and lows is described in detail. ⇒【How to define highs and lows with no guesswork in FX! Swing highs and swing lows】 |
STEP2Which to connect: the wicks or the bodies?
When drawing trend lines, this is almost always a point of debate.
In short, either is fine.
The reason is that some traders draw with the wicks, and others with the bodies.
In practice, both work to some extent.
That said, drawing with wicks or bodies for your own convenience is NG.
Because it breaks consistency in how you draw lines.
Decide for yourself whether to connect with the wick or the body and set a rule.
STEP3When to draw the trend line?
This is the most important point in how to draw trend lines!
The main reason trend lines become ‘lines for convenience’ is that you don’t know the timing to draw them.
If you draw too early, the line becomes meaningless.
Therefore, the timing to draw trend lines is very important.
Below are the timing rules for drawing trend lines.
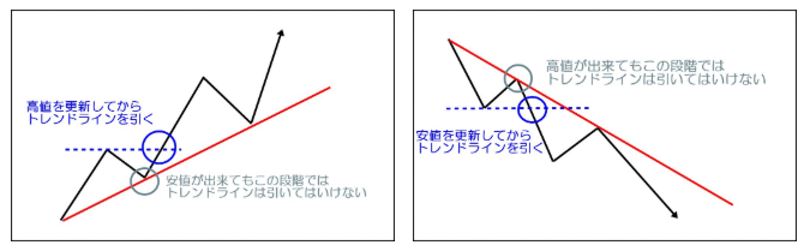
【Timing to draw an ascending trend line】
After updating the most recent high, connect the starting low and the most recent low.
【Timing to draw a descending trend line】
After updating the most recent low downward, connect the starting high and the most recent high.
Next, let's verify on actual charts.

Drawing a trend line is not just about drawing it.
There is no need to rush.
Confirm higher highs and higher lows before drawing the trend line.
STEP4Redrawing trend lines
Trend lines need to be redrawn.
The timing for doing so is also important.
First, look at the image below.
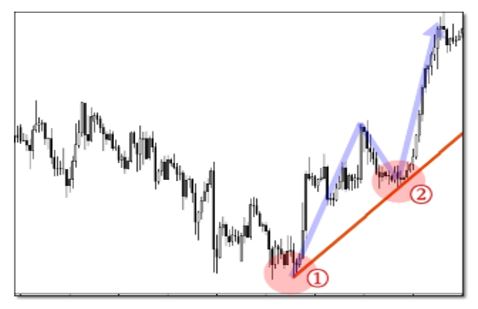
【Ⅰ】Because the high was updated upward, I drew the trend line by connecting Low ① and Low ②.
But the chart ends up as shown below.
【Ⅱ】The closing price fell below the trend line.
Nevertheless, according to Dow Theory, the uptrend remains intact.
In this case, if you place the utmost emphasis on the trend line, you should be cautious about a trend reversal.
What happened after that on the chart is...

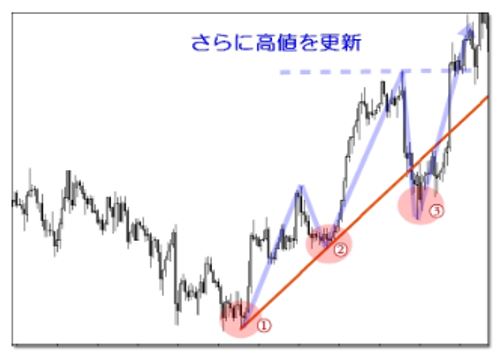
【Ⅲ】The initial trend line was broken by the close, but after making a new low (Low ③), the price again updated to a new high.
What should be done with the trend line after this?
【Ⅳ】The initial trend line may not have been strongly noticed by many traders.
So, redraw the trend line by connecting Low ① and the most recent high before Low ③ was updated, and draw it again.
In fact, afterward, the price rebounded nicely at Low ⑤.
STEP5Invalidating the trend line
Redrawing trend lines helps you draw lines that are more likely to be noticed.
So,how long should you keep redrawing?
That is
‘until the trend line is invalidated’.
If you don’t know this invalidation, you may miss a trend reversal and again end up with a line drawn for convenience, so be careful.
Now, I will explain the procedure for invalidating trend lines.
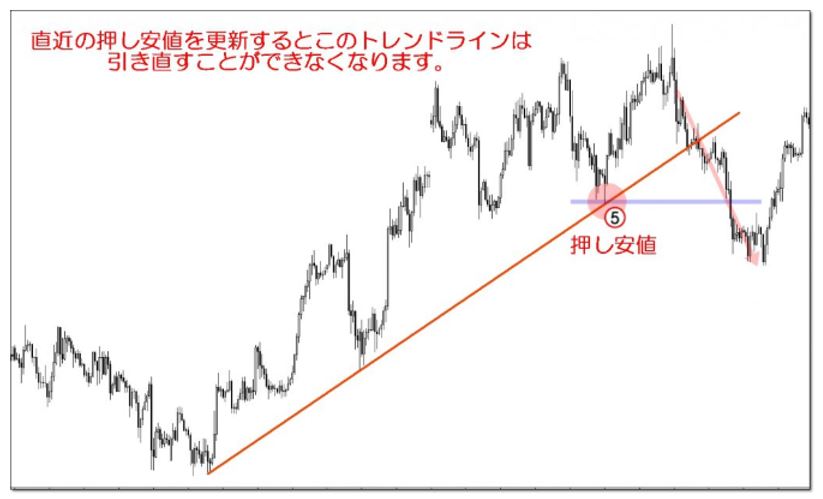
The most recent low that updated the highest price is called the push-low (force low). For push lows and retracement highs, see the article below. ⇒【How to determine trend reversal/continuation signals by updating push lows and retracement highs】 |
At the moment the price updates Push-Low ⑤ downward (blue band in the diagram above), the rising trend line drawn earlier becomes invalid, and further redrawing of the trend line is no longer possible.
According to Dow Theory, the trend is considered broken at that point, and the trend line is invalidated.
This is called‘Invalidating the Trend Line’.
Indicator that clearly marks push lows and retracement highs ⇒‘MT4 indicator that automatically detects highs, lows, retracement highs, and push lows’ |
Common mistakes in drawing trend lines
Here, I will explain some common mistakes in drawing trend lines.
This is a method surprisingly many traders use.
I will explain using the chart from the previous section on ‘Invalidating the Trend Line’.
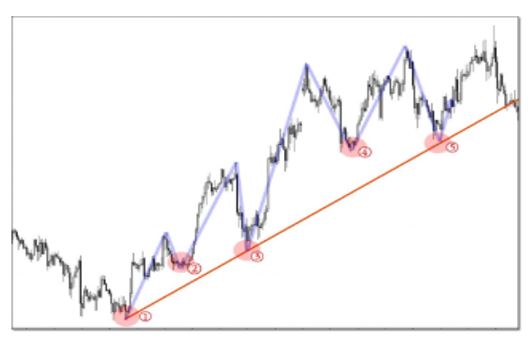
Please look at the chart below.
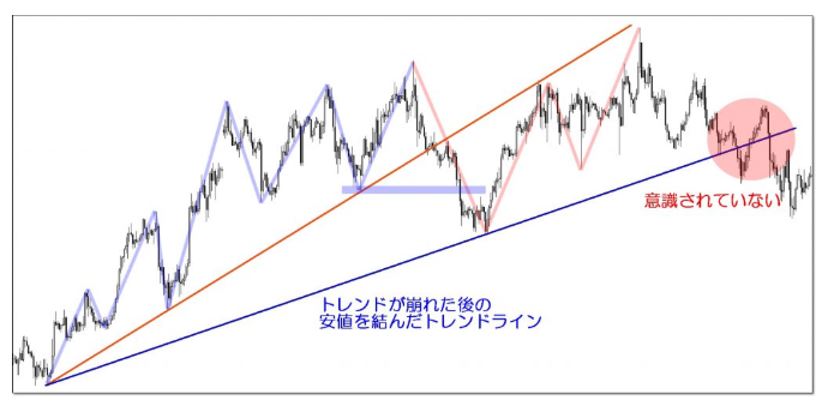
The blue trend line connects the highs of a trend that has already broken, right?
This is a wrongly drawn trend line.
How about that? Isn’t this something many people do?
The red trend line is the correct one, and you can see it still acts as resistance on the right side of the chart.
In contrast, the wrongly drawn blue trend line on the right side of the chart does not react at all.
Of course, it may react sometimes.
However, that may simply be because a larger trend happened to react to a larger scale, not because your line is valid.
If you do not keep the scale of the trend consistent, you can draw lines anywhere.
Summary
Trend lines are a basic of technical analysis.
Because of that, they are a focal point many traders watch, and that focal point is where the trading edge lies.
By learning to draw correct trend lines, you can forecast the market a step ahead of your competitors.
Refer to this article and make trend lines a weapon in your trading toolbox.