
A professional’s guide to correctly defining high and low prices

この記事は 【FXで迷わず高値・安値を定義付けする方法!スイングハイ・スイングロー】 でより詳しく解説されています。 |
You will learn the world-standard analysis method called Dow Theory.
And when your trading level rises, you will surely struggle with one thing.
Yes, the 'definition of highs and lows.'
『Is it really okay to treat this as the high?』
The way you define highs and lows completely changes how you read the charts.
Moreover, because different traders recognize highs and lows differently, it becomes even more confusing…
In this article,【The professional’s method for defining highs and lows】will be explained.
If you systemize the rules for defining highs and lows, the market becomes visible!
The reason for systemizing the definition of highs and lows in trading is to clearly recognize trends and ranges.
What this means is that the chart forms by tracing waves starting from highs and lows.
Based on those highs and lows, traders form an environment view such as uptrends, downtrends, or range markets.
But what if you were to set the wrong high or low?
You would always conduct different market analyses and repeatedly trade based on different criteria.
Therefore, to perform correct chart analysis, you should standardize your recognition of trends and ranges.
Here, let's quickly review the definitions of trend and range.
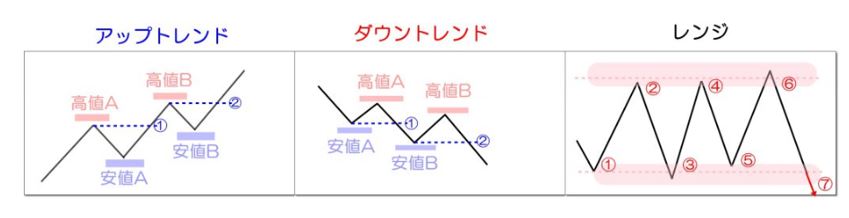
◆Definition of Uptrend… highs and lows are stepping up from the previous highs and lows.
◆Definition of Downtrend… highs and lows are stepping down from the previous highs and lows.
◆Definition of Range… prices move up and down within a fixed width.
※The following article explains in detail. ⇒【Why Dow Theory is so important|Anyone can easily identify entry points】 |
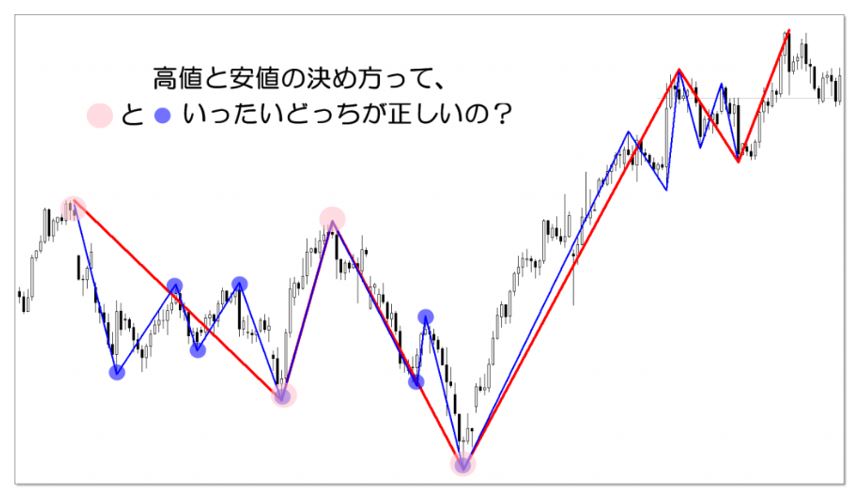
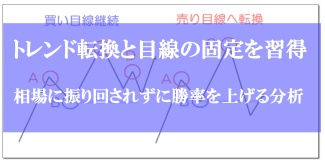
By deciding which of the blue circle or red circle on the chart is the high or low, the trend changes, doesn’t it?
Depending on how you define highs and lows, the trend can reverse, and the turning points of trends will differ.。
※For trend turning points, see below. ⇒【How to identify trend turns and continuations: breakouts of swing highs and swing lows】 |
For these reasons, it is extremely important to systemize the definition of highs and lows.
Defining highs and lows (What are Swing Highs and Swing Lows?)
Among methods for defining highs and lows, a widely used approach by professionals is the Swing High / Swing Low analysis method.
(It’s very simple, yet highly effective。)
Below are the definitions for Swing High and Swing Low.
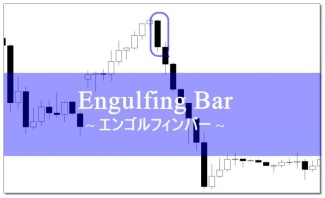
Swing High
⇒ If six highs are formed to the left and right around the peak, it is a Swing High
Swing Low
⇒ If six lows are formed to the left and right around the trough, it is a Swing Low
Since text is hard to understand, please look at the diagrams.
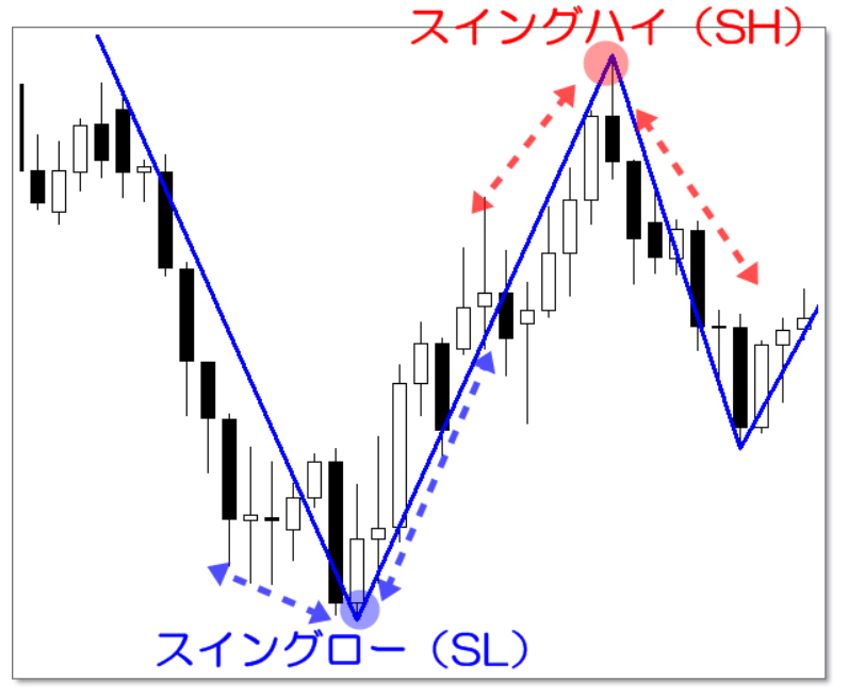
In the images, it’s easy to verify.
Now, 'why six?'
There are several reasons for this.
First, Larry Williams, a world-renowned trader (famous for the book 'How to Trade in the Short Term by Larry Williams'), uses Swing High and Swing Low with six bars on each side.
Second, a week contains five to six daily candlesticks, which aligns with this rule.
Let’s verify Swing High and Swing Low on actual charts.
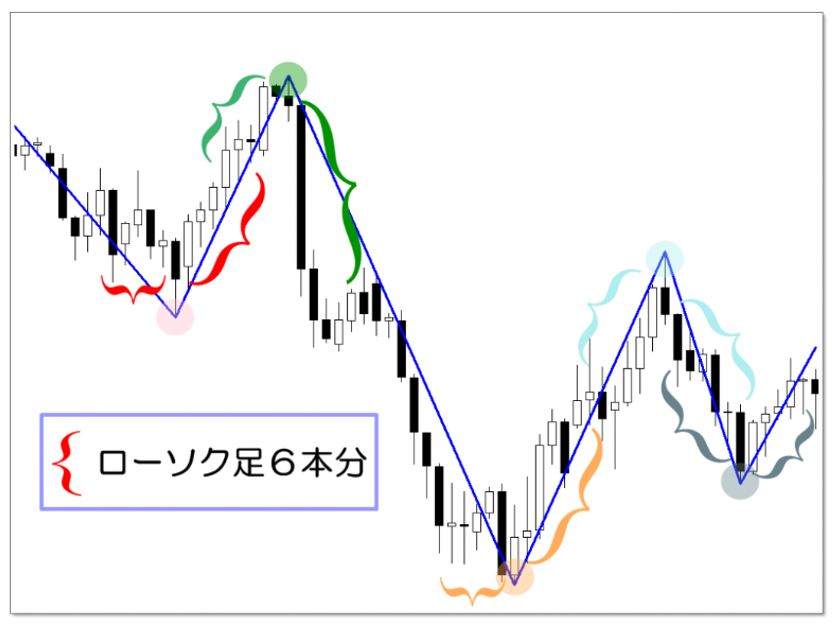
As shown in the figure, Swing High and Swing Low are determined by a left-right six-bar rule, forming highs and lows.
Then you can observe clean waves defined by high and low.
Once highs and lows are known, even complex charts can be organized
Charts are not always cleanly waved.
At times, complex waves appear, and you form charts with vague highs and lows.
In such cases, the most troublesome question is 'Where should I place the high or low?'
However,if the rules for defining highs and lows are solid, you can analyze the market with confidence.
Now, let’s look at charts where highs and lows are ambiguous.
Consider common ranges where highs and lows are held evenly.
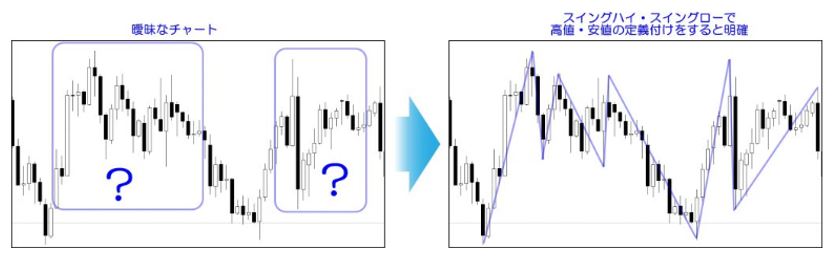
How about it?
By using Swing Highs and Swing Lows, even ranging markets can have clear highs and lows.
With a set of rules, any chart can have its highs and lows organized.
An indicator that clearly marks swing highs and swing lows and pullbacks ⇒『MT4 indicator that automatically detects highs/lows and pullback highs/low points』 |
Trendlines using Swing Highs and Swing Lows

Next, I’ll show how to draw trendlines using Swing Highs and Swing Lows.
Trendlines are fundamental to technical analysis, but they can be surprisingly difficult.
This is because,
・You don’t know the rules for drawing the correct trendline.
・Highs and lows have not been standardized.
If you don’t know these two rules, you can draw trendlines wherever you like.
Trends drawn to fit your convenience are called
‘convenience lines’
and I used to draw those all the time.
I also used to draw convenience lines a lot in the past.
The proper way to draw trendlines is explained in detail in the following article. |
Here, I also share an easy method to draw trendlines that anyone can use.
If you have the highs and lows definitions introduced so far, you can draw functional trendlines.
This will enable correct analysis.
Summary
We have explained the definition of highs and lows.
By knowing and fully understanding the rules for defining highs and lows, I gained a fixed view of chart analysis, and my market analysis speed and accuracy dramatically improved.
Moreover, by having my own axis that ‘this is correct,’ I gained confidence in trading.
For other articles, please readAke’s FX Blog』.