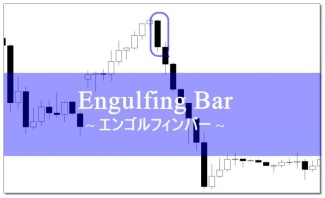

Master multi-timeframe analysis to develop high-win-rate methods
This article 【How to learn multi-time-frame analysis to revive FX methods】 is explained in detail in. |
Have you heard the term multi-time-frame analysis?
It is a more important method of analysis than the method itself for increasing trading win rate and profitability.
That is『Multi-Time Frame Analysis』.
Here, we will explain multi-time-frame analysis.
What is multi-time-frame analysis?
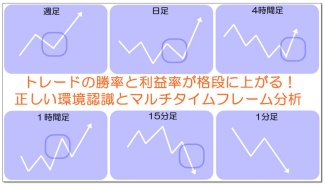
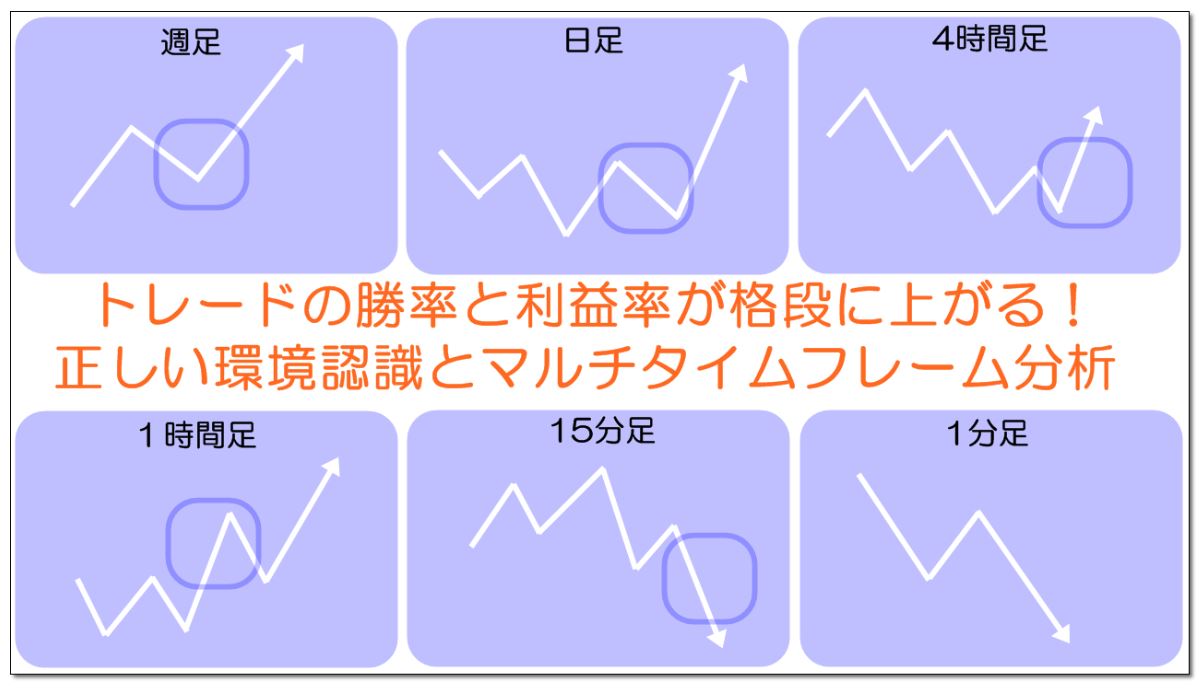
Multi-time-frame analysis is an analysis method that looks at several timeframes to determine entry directions and entry points for selling and buying.
Specifically, it analyzes using three timeframes: long-term, medium-term, and short-term.
The roles of each timeframe are as follows.
Long-term and medium-term⇒ Analyze big trends
Role of short-term⇒ Follow the trend to find the entry direction and entry point.
There are two main advantages to this analysis.
One is that by following the direction of the long-term or medium-term trend, win rate in short-term trades increases.
The other is that trading within the long-term/medium-term trend with the short-term timeframe adds energy from all three timeframes, making it easier to reap larger profits.
Multi-time-frame analysis is considered with long-term, medium-term, and short-term
Multi-time-frame analysis analyzes long-term, medium-term, and short-term timeframes.
First, please look at the following image.
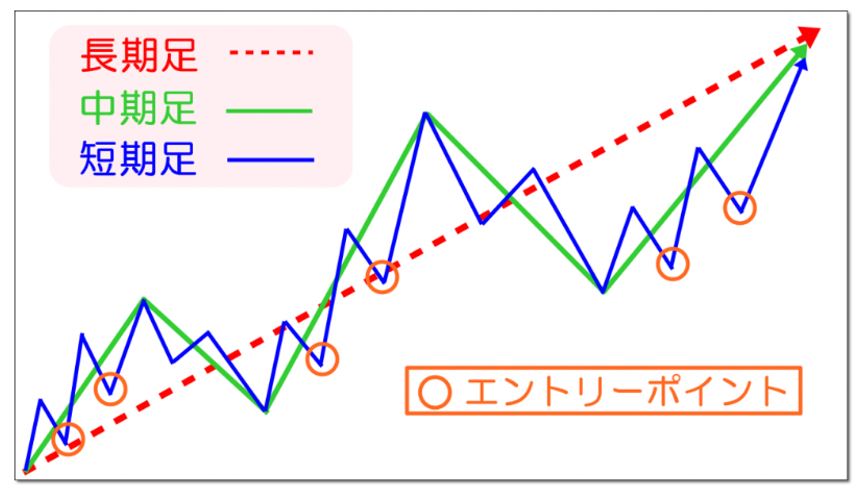
In the long-term wave, there are several waves in the medium-term wave.
Furthermore, within one of the waves of the medium-term there are multiple short-term waves.
Here, if you follow the direction of the long-term and medium-term trends and enter at the short-term circle, you can safely increase profits, right?
In this way, identifying high-probability entry points in an overall sense is called multi-time-frame analysis.
Now, instead of the image, let's use actual charts to analyze multiple timeframes.
Please look at the following image.
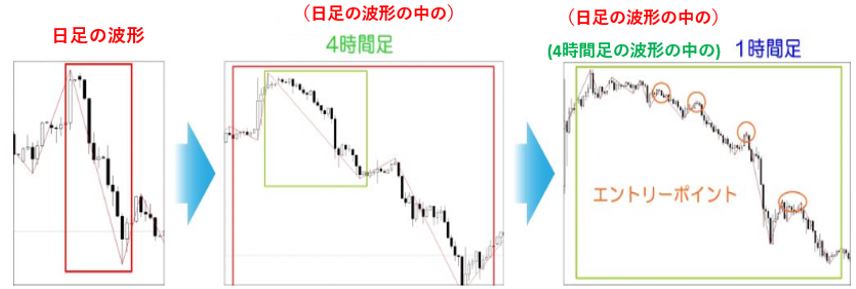
Step① [Daily]
Focus on the downward trend in the daily chart waveform.
Step② [4-hour]
The 4-hour timeframe also confirms a downward trend.
Now, let's check one of the waves in the 4-hour downward trend on the 1-hour chart.
Step③ [1-hour]
If you enter at a retracement high during the downward trend, you can safely achieve large profits, right?
By comprehensively analyzing the long-term, medium-term, and short-term timeframes like this, the accuracy of entries greatly increases.
How to conduct multi-time-frame analysis
From here, we will introduce concrete methods for actual multi-time-frame analysis.
【Step 0: Analyze from the long-term timeframe】
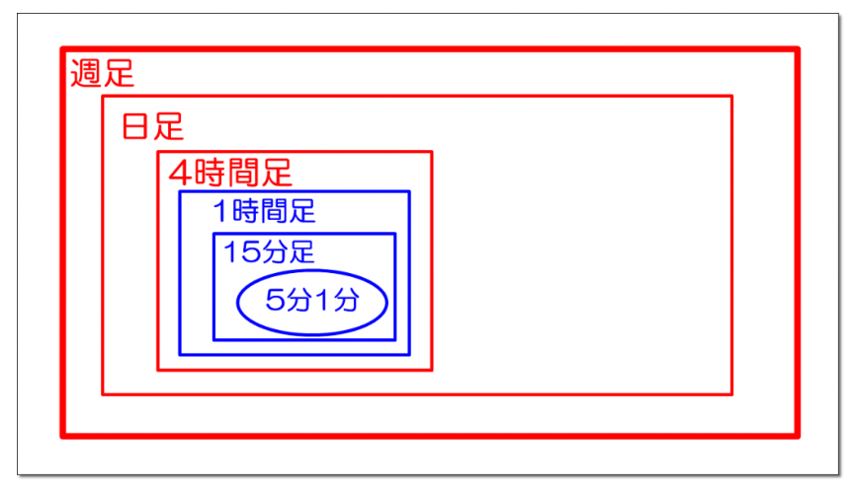
Multi-time-frame analysis starts from the longest timeframe, the long-term chart.
The reason is that there are more traders who look at the 1-hour chart than those who look at the 1-minute chart, and more who look at the daily chart than those who look at the 1-hour chart.
In other words, the greater the number of traders watching, the higher the edge.
【Step ①: Confirm the long-term trend】
First, check the trend and state of the long-term timeframe.
What state is the long-term timeframe in? What kind of trend is occurring?
As a result of the analysis, there are three main patterns.
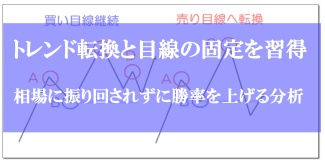
① A trend-following direction in the direction of the trend
② A contrarian direction against the trend
③ A range state
Trades are easier to understand with ① and ②, so we will explain ① and ②.
First, let's actually analyze the long-term chart.
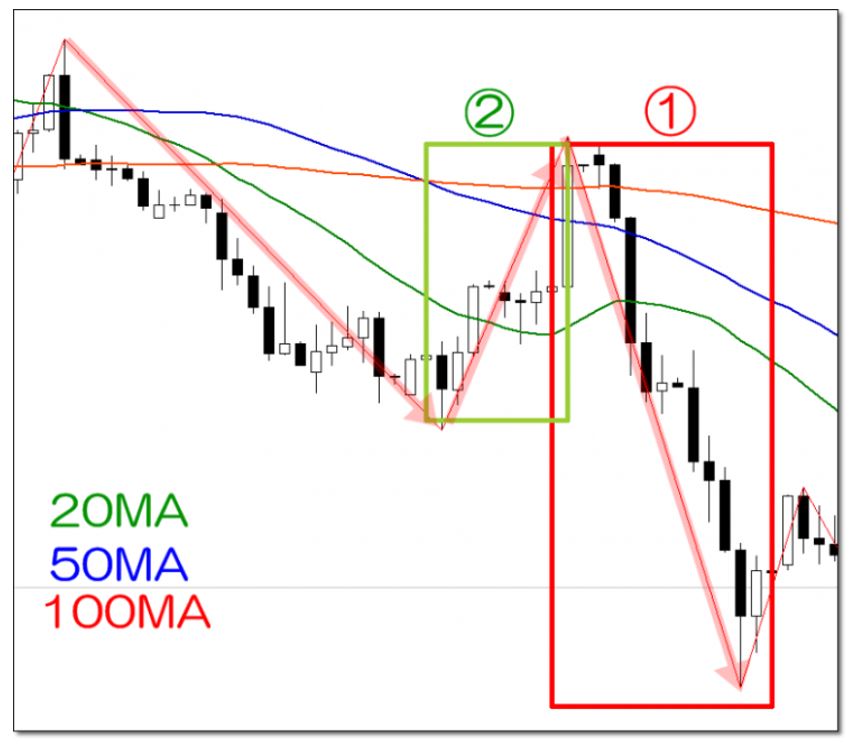
【Market analysis】 The daily timeframe shows20MA,50MA,100MA all heading downward. Although not visible in the image, the swing lows are being updated downward, indicating a selling bias in the downtrend.
If you cannot identify the swing lows or vantage point shifts, please refer to the article below. ⇒【How to discern trend reversal and continuation signals by updating swing lows and swing highs】 |
From this figure, you can see the following.
① Selling on the downward trend direction in a trending move ⇒ (small loss, large profit | low risk)
② Buying against the downward trend direction ⇒ (small loss, small profit | medium to high risk)
With the above analysis in mind, check the medium-term timeframe.
【Step② Confirm the medium-term |Step③ Look for entry points on the short-term
Step① After confirming the long-term trend and state,Step② Confirm the direction of the medium-term.
ThenStep③ Look for entry points on the short-term.
Here, we describe two points below.
① Trend-following in the direction of the trend ⇒ (small loss, large profit | low risk)
② Contrarian in the direction of the trend ⇒ (small loss, small profit | medium to large risk)
① When entering in the long-term trend direction with trend-following (small loss, large profit | low risk)
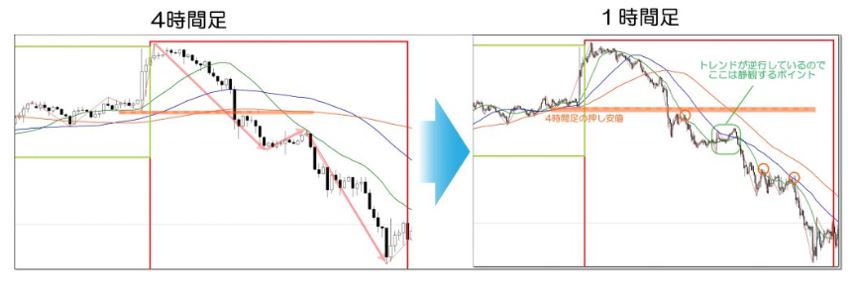
【Daily】 The long-term chart was in a downtrend.(Step① image)
【4Timeframe】 Broke below the orange swing low, confirming a downtrend. From here, we will check the 1-hour timeframe with a selling bias.
For swing lows and vantage shifts, see the article below for an easy explanation. ⇒【How to discern trend reversal and continuation signals by updating swing lows and swing highs】Please refer to it. |
【1Timeframe】20MA,50MA,100MA all head downward in the same direction.
Moreover,MA positions are ordered from long-term, medium-term, to short-term from top to bottom.
This state is called a perfect order and is often seen when a trend clearly forms.
And, with the orange circle, you can enter on a rebound of the MA.
The point of entry has been profitable, right?
② When entering in the long-term trend direction with contrarian (small loss, small profit | medium to large risk)
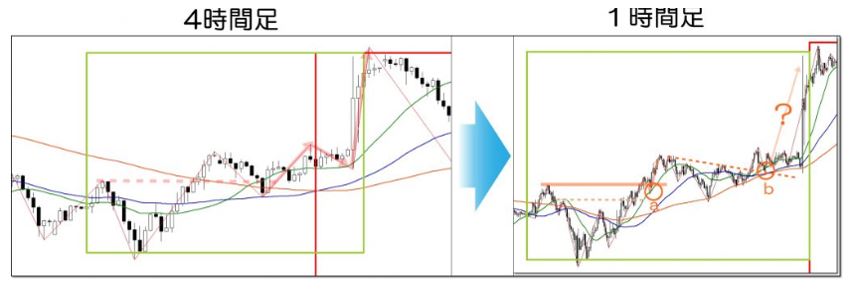
【Daily】 The long-term chart was in a downtrend。(Step① image)
【4Timeframe】 A breakout above the retracement high shifts the bias to buy.
Therefore,1Timeframe will be checked for buying bias.
The analysis shows the daily is in a downtrend, but there is a retracement that suggests an upward move.
4Timeframe is in an uptrend with a buy bias.
In the short-term, consider buying.
【1Timeframe20MA,50MA,100MA are all pointing upward and display a perfect order.
The orange circle marksa,b entries based on MA rebounds.
Below is a summary of the considerations fora,b.
a.Ultimately profitable, but the profit range is small relative to the risk.
b.Profits extend greatly, but can you actually wait that long?
On the daily, the trend is downward,4Timeframe is upward.
Two timeframes in opposite directions make entry risky and caution is required.
Thus, when long-term and medium-term timeframes are out of sync, a discretionary judgment is needed on whether to exit quickly or stay on the sidelines.
If you want certainty, staying on the sidelines is better.
All about technical analysis and methods to increase trend-following win rate are packed into the following article. ⇒【FX Trend Following Methods Encyclopedia | Fully master trend following in one article | Ultimate edition |
Multi-time-frame analysis using moving averages
Here, we introduce multi-time-frame analysis using moving averages.
Moving averages are among the indicators most widely used by traders worldwide.
Even a single moving average can function well, but displaying multiple moving averages makes it even more useful.
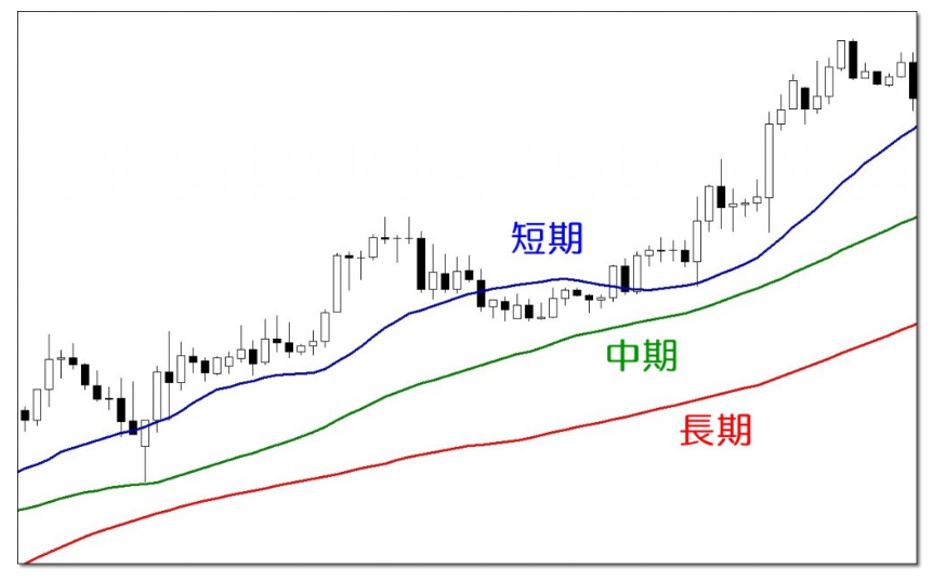
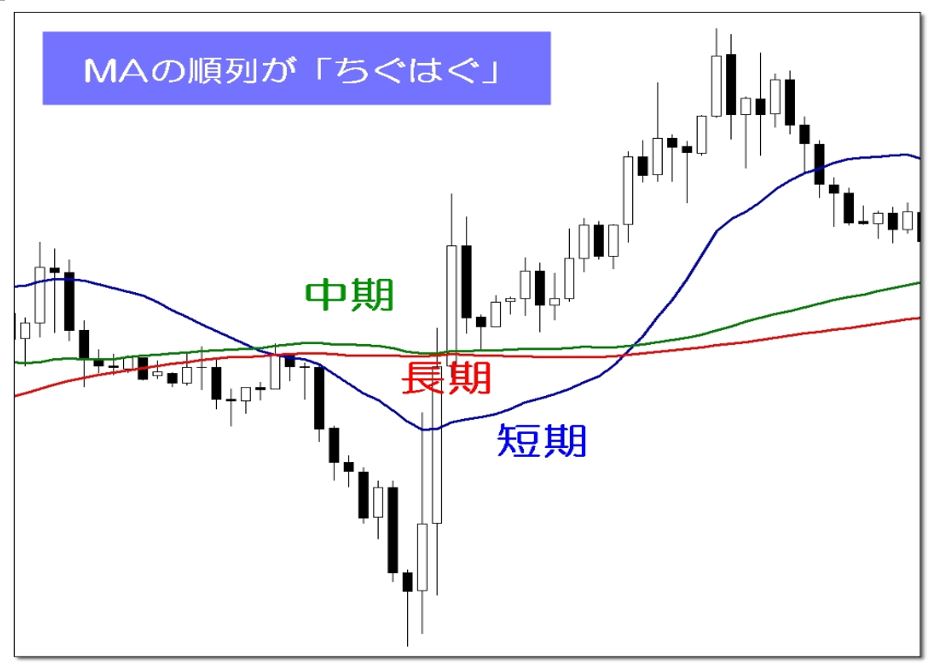
Here, three moving averages will be displayed.
As shown in the image below, it is easy to tell whether the market is in a trend or in a range or a correction.
【Trending market】
(Perfect order)
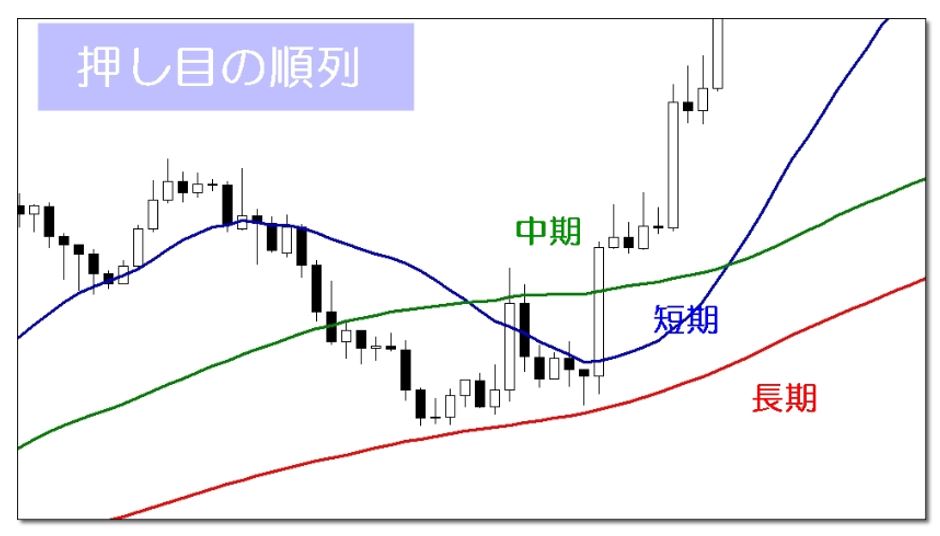
【Consolidating market】
(pullback and retracement)
【Non-trending market】
In the three market states using moving averages, detailed explanations are provided in the following article. |
Using moving averages to analyze these three market states with multi-time-frame analysis improves entry accuracy.
Analysis using moving averages is easy to understand, so beginners can use it with confidence.
If used together with the multi-time-frame analysis explained here, it becomes a very powerful tool.
※ For moving average-based multi-time-frame analysis, see the following article for an easy explanation. ⇒【FX Methods’ Essentials! 3-Book Moving Averages for High-Return Trades via MTF Analysis】 |
Using multi-time-frame analysis to time buying dips and selling retracements
So far, what we explained is basically trend-following trades.
In trend-following, you trade based on buying dips or selling retracements, but in reality, questions like the following arise:
『I’m not sure how to define a dip or retracement. What counts as a dip or retracement?』
‘How far should I wait for a dip or retracement?’
In truth, it's easy to understand in theory, but difficult in practice.
However, buying the dip or selling the retracement can be highly accurate if multi-time-frame analysis is properly implemented.
Details on buying the dip and selling the retracement are covered in the following article. ⇒【High-probability timing for buying the dips and selling the retracements! Don’t miss the clusters!】 |
Summary
If you can use multi-time-frame analysis well, you will be able to see, understand, and win on charts.
Winning traders only trade in places with high probability of success.
They are always seeking those winning places and environments.
That is exactly multi-time-frame analysis.
Now, let’s look at charts and analyze them!
For information on other articles, please readAKE’s FX Blog..