

How to discern trend reversal or continuation signals
This article is 【How to spot trend reversals and continuations: updating swing lows and pullback highs】 for a more detailed explanation. |
If you buy, the price falls and you cut losses; if you sell, the price rises and you cut losses.
For some reason, it’s always about cutting losses...
Haven’t you had experiences like that?
Why does the market move you around?
That’s becauseyou haven’t fixed your trading perspective.
Fixing your trading perspective can be decided by learning how to identify trend reversals.
This article willexplain how to identify trend reversals.
By reading this article, you will understand how to identify trend reversals, and your profitability and win rate will improve dramatically.
To extend profits, identify trend reversals
The big difference between winning traders and losing traders is whether they understand the [trend reversal].
Certainly, if you understand Dow Theory, you can understand trends well enough.
The basic ideas of Dow Theory are explained in detail below. ⇒【Is Dow Theory that important? Easy entry points for anyone】explained in an easy-to-understand way. |
However, that alone doesn’t guarantee many wins.
Understanding【Trend Reversal】【Trend Continuation】allows for deeper analysis of Dow Theory.
Please look at the figure below.

This is a point where, if you had sold, the rate would have risen, and if you had bought, the rate would have fallen.
If you cannot understand “trend reversal” and “trend continuation,” you’ll be moved around by the market like this.
So, what kind of trades do elite traders make?
The answer is, they both skip entries.
Because,
they cannot buy because they haven’t confirmed trend continuation.
they cannot sell because they haven’t confirmed trend reversal.
As a result, in this case, they do not trade and remain sidelined.
Trading only has three patterns: buy, sell, or stay out.
Are you currently in a buying perspective or a selling perspective?
If you know that perspective, you can trade in that direction.
To determine that perspective, you must accurately identify trend reversals and trend continuations.
So, what are the specific signs for trend continuation and trend reversal?
What are the most important swing lows and swing highs?
From here, we will explain trend continuation and trend reversal, but first there is an important item.
That is the important swing lows and swing highs that form the basis (origin) for trend continuation and reversal.
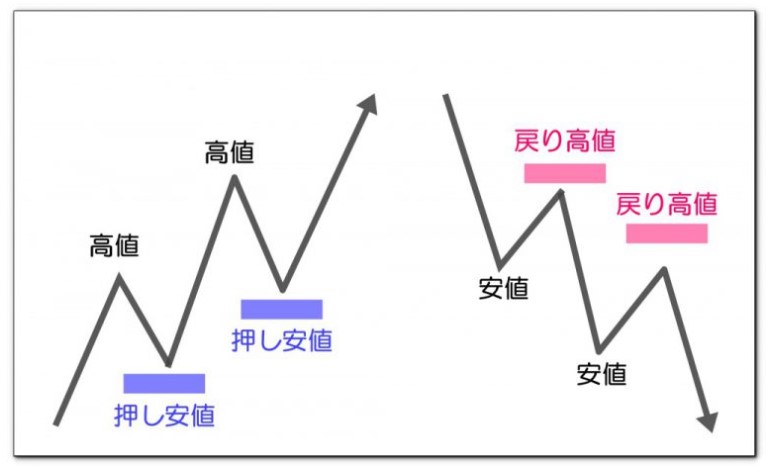
The terms for the highs and lows that become the starting point of trends are called【Push Lows】and【Pullback Highs】.
In the next section, we will explain【Push Lows】 and【Pullback Highs】, which are crucial for trend reversals and continuations.
Definitions of【Push Lows】【Pullback Highs】 vs ordinary highs/lows
【Push Low】 Definition The low just before a new high is updated as the starting point 【Pullback High】 Definition The high just before a new low is updated as the starting point 【Ordinary Low】 Definition...not a Push Low 【Ordinary High】 Definition...not a Pullback High |
Words may be hard to grasp; let’s confirm with pictures.
The method to define highs and lows is explained in detail in the following article. ⇒【How to define highs and lows clearly in FX! Swing highs and swing lows】is explained clearly, so please refer to it.is explained clearly, so please refer to it. |
Updating Push Lows and Pullback Highs
Definitions of【Push Low】 and【Pullback High】remain as above.
Next, we will explain the most important point in trend reversal: updating【Push Low】 and【Pullback High】.
First, please look at the following image.
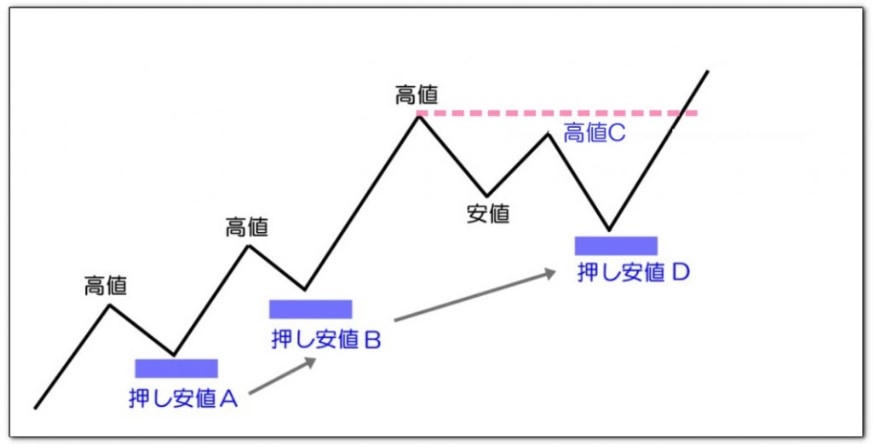
Push LowAand Push LowBbecome lows when the previous high is updated.
The key point in this diagram is Push LowD.
Push LowDis confirmed not when it breaks the highCbut when the pink line’s maximum is updated.
Indicators that show highs, pullback highs, lows, push lows, and trend reversal lines are explained in detail below. |
Tips for identifying trend reversal and trend continuation
Have you understood【Push Low】【Pullback High】?
From here, we will explain the main topic: how to identify trend reversal and trend continuation.
Here, only the buying scenario will be described.
Definitions are as follows.
【Trend Continuation】 From the Push Low that starts the new high, the trend continues until that low is updated to a new low 【Trend Reversal】 If the Push Low, the starting point of the latest high update, breaks downward, the trend reverses |
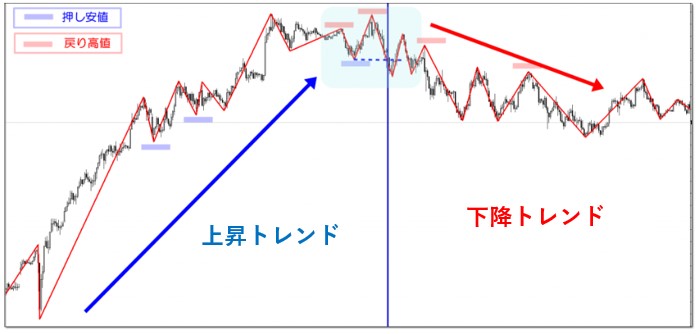
Now, we will confirm each point with diagrams.

①② … Highs are updated and Push LowAand Push LowBare confirmed, establishing an uptrend.
③-1
By lowering highs and lows, a small downtrend forms. Here the uptrend ends.
③-2
Switching to a selling perspective is tempting, but since the recent Push LowBhasn’t been broken yet, keep the buying perspective.
③-3
That said,this isn’t a buyable moment, so stay sidelined.
Whether you can stay sidelined here is the dividing line between winning and losing traders.
③-4
Although still biased to buying, the uptrend hasn’t been confirmed yet.
When Push Low creates a pink dot line and surpasses its high, the uptrend is confirmed. Until then, it may be ranging.
④ Push LowBbreaks the starting high, confirming the uptrend here.
⑤ With a new high updated upward, Push LowDis updated.
⑥ Finally, Push LowDbreaks downward, so you can switch to selling perspective here for the first time.
In trend continuation and reversal, the crucial points are scenes ③④⑤⑥.
The way you interpret charts at these points dramatically changes the quality of your trades.
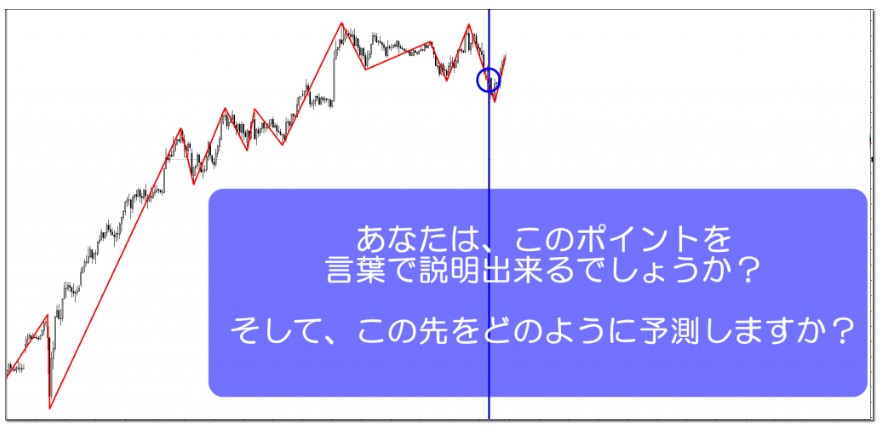
Confirming trend reversal
First, look at this image.

How about it?
Have you been able to imagine the future scenario?
The answer is,
『Because Push Low broke downward, the uptrend is completely over. Therefore, there is a possibility of trend reversal, so consider a selling perspective.』
Now, let’s look ahead on this chart.
The updated Push Low(blue dotted line)broke downward and the downtrend was confirmed.
The sign of trend reversal is the vertical blue line.
From this trend reversal signal, we can conjecture the following.
“Institutions and other large traders may have taken profits...”
“The trend has reversed and the market may be biased to the selling side...”
“Let's pause buying for a while.”
By accurately identifying such trend reversal signals, you can reduce unnecessary losing trades.
Why are Push Low and Pullback High important?
Why are the starting points of new highs and new lows, Push Low and Pullback High, so important?
Push Low and Pullback High are where positions (open orders) that update new highs or new lows gather.
Let’s confirm with images.
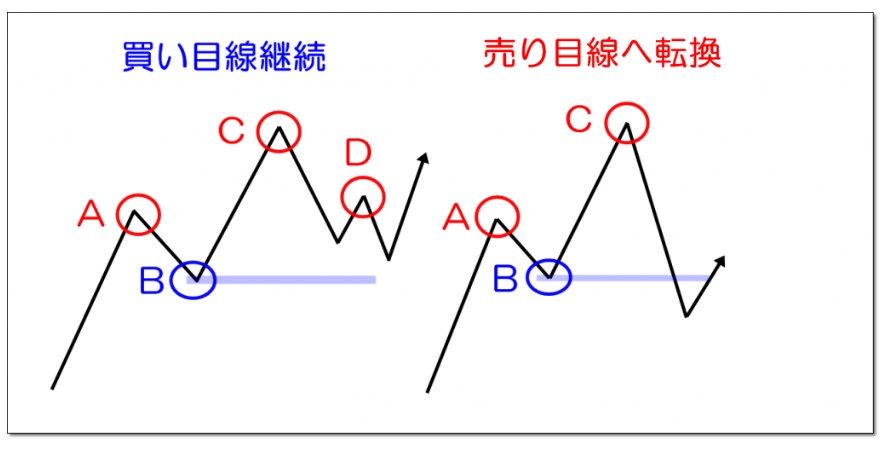
(Left image)
Push Lowin Push Low is the point where buyers prevailed over sellers.
CandDselling playersB
Key: If an important Push Low is held⇒more buy positions than sell positions = buy perspective continues
(Right image)
Push Low is the point where buyers prevailed over sellers at B.
Then,Csellers break below B, indicating sellers have the upper hand.
Breakthrough of the important Push Low⇒more sell positions than buy positions = switch to selling perspective
Summary
Understanding trend reversal and trend continuation may vary among traders.
However, traders worldwide look at the same charts, so what you feel from the chart is the same.
That crucial “point” isthe Push Low and Pullback High that mark the start of new highs and new lows.
Now, quickly look at the chart to confirm Push Low and Pullback High.
If you want to read more,
please refer to it.