
If you put it off, it’s dangerous! If you want to win, understand the Dow Theory and improve your analytical skills!
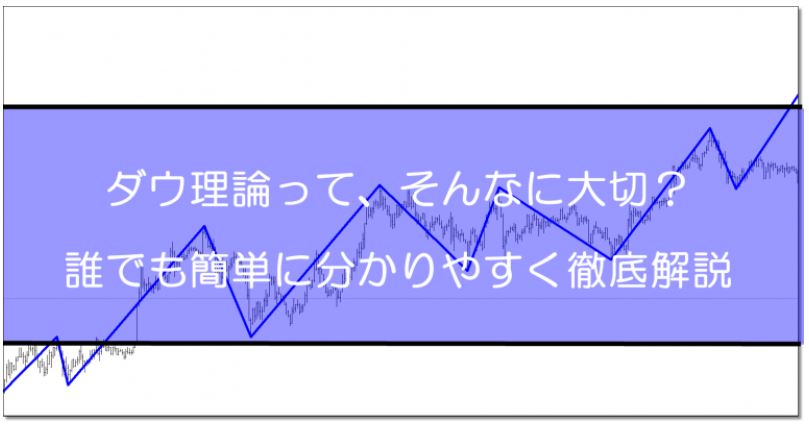
This article explains in detail about 『Is it that important? What is Dow Theory—easy entry points for everyone』here. |
Dow Theory, the most important in trading
In my beginner days, no matter what indicators or methods I tried, I couldn’t win.
Because I couldn’t win, I looked for other methods.
After that, no matter what methods I tried, I could not win.
Why can’t I win?
That’s because I traded without following the essential market analysis known as Dow Theory.
Yes, if you don’t know Dow Theory, you can’t win with any method.
Why is Dow Theory so important?
Dow Theory is a historical theory
Dow Theory is a chart analysis theory proposed by Charles Henry Dow, an American financial analyst, in the late 19th century.
100years old and still used today.
In other words, skilled traders around the world understand it.
However, as a beginner trader, I tried to trade without knowing Dow Theory.
That’s a bit reckless, isn’t it?
Dow Theory, the global standard for traders
Not only in the forex market but also in stocks and futures, traders worldwide pay attention to this standard.
That standard is, of course, “Dow Theory.”
In the trading world, there is a saying!
“Trading is a beauty contest”
Movements that many traders are watching are the most important!
In other words, the market is a matter of the majority rule.
Rather than obscure indicators, the majority’s advantage matters.
So, what exactly is it that many traders are focusing on?
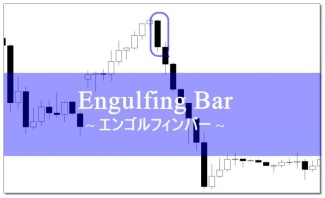
That is【Candlesticks】 and【Dow Theory】.
For candlestick analysis, it is clearly explained in the following article. ⇒【Win with Candlestick Price Action! FX Powerful Signals 7 – The Definitive Guide】 |
Indeed, indicators are necessary for technical analysis.
Advanced traders also trade using indicators.
But winners trade with a consistent market standard before using indicators.
That standard is【Dow Theory】.
Now, let’s explain【Dow Theory】.
What is Dow Theory?
Dow Theory is said to be built on six basic principles.
① Everything is reflected in market prices ② There are three kinds of trends ③ The main trend has three stages according to market movement ④ Averages must confirm with each other ⑤ Trends must also be confirmed by volume ⑥ Trends continue until they clearly show reversal signals |
Hmmm, it’s a bit hard to understand yet, isn’t it.
But don’t worry.
The theory itself is simple, so let’s start explaining.
① Everything is reflected in market prices
Market prices aren’t only influenced by economic indicators, disasters, or corporate earnings.
In other words,All events including fundamentals are reflected in the resulting market price.
② There are three types of trends
Within Dow Theory, trends are broadly classified into three based on their duration.
・ Major trend lasts about 1 year to several years.
・ Secondary trend lasts about 3 weeks to 3 months.
・ Minor trend lasts under 3 weeks.
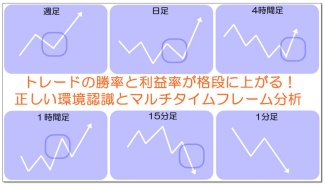
In simple terms,there is a large trend containing a medium trend, which in turn contains a smaller trend.
From a charting perspective, this means multi-time-frame analysis (long-term, mid-term, short-term) can be used in trading.
Multi-time-frame analysis is explained in detail in the following article. |
③ The main trend has three stages depending on market movement
Trend early stage (Leading phase), trend mid-stage (Following phase), trend late stage (Profit-taking phase).(Leading phase), trend mid-phase (Following phase)(Following phase), trend late phase(Profit-taking phase).
Below are explanations for each trend.
“Trend Early Phase(Leading Phase)”: A stage where a few market participants start buying at the lows with risk-taking.
“Trend Mid-Phase(Following Phase)”: After confirming price rise, other market participants begin to follow and buy.
“Trend Late Phase(Profit-Taking Phase)”: Early-stage participants start taking profits.
Let’s check with an illustration.
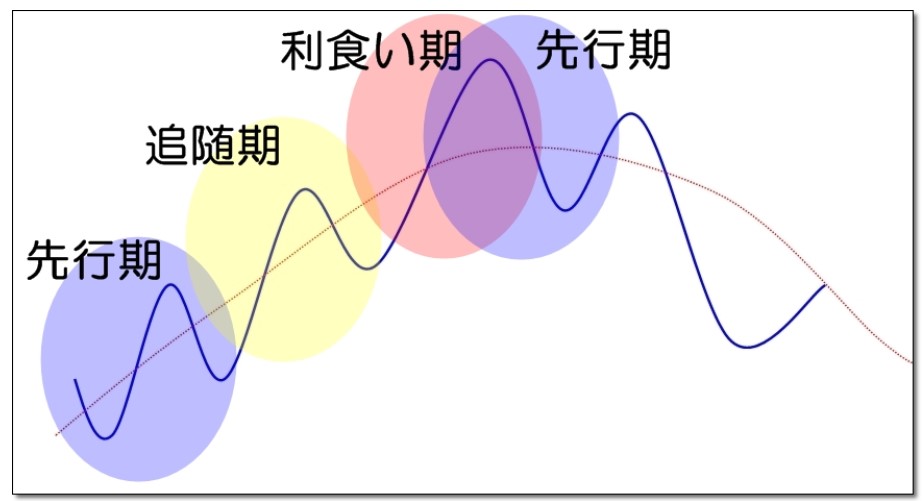
To put it simply,Top traders (advanced) enter in the Trend Early to Mid phase, while losers (beginners) tend to enter in the last Trend Late phase.
Markets move significantly due to participants’ market psychology and mass psychology.
For more details, see the following article. ⇒【Why do winning FX traders focus on highs and lows? The Power Dynamics of the Market】 |
④ Averages must confirm with each other
Dow Theory originated in the stock market.
Here, “averages” refer to average stock prices.
When the trends of two stock averages confirm, a clearer trend can be identified.
Some may think this is a bit different from FX, but if you want to improve win-rate and profit, you’d better apply it.
With that in mind, applying it to FX would look like this:
For example,
USDJPY + Nikkei Average = Trend
Dollar Index + Dollar Spot Rate = Trend
USDJPY Bearish + GBPUSD Bearish = Pound-JPY Ultra Bearish
⑤ Trends must also be confirmed by volume
When a major trend moves, volume tends to rise proportionally.
In other words, trends are proportional to volume.
However,FXmarkets are larger than stock markets, so volume is hardly identifiable.
Therefore,in FX, this theory is bypassed.
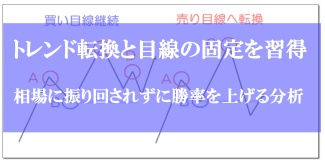
⑥ Trends continue until clear reversal signals appear
This theory“the most important and core part of Dow Theory”is not an overstatement.
Once a trend has begun, it continues until a clear reversal signal occurs..
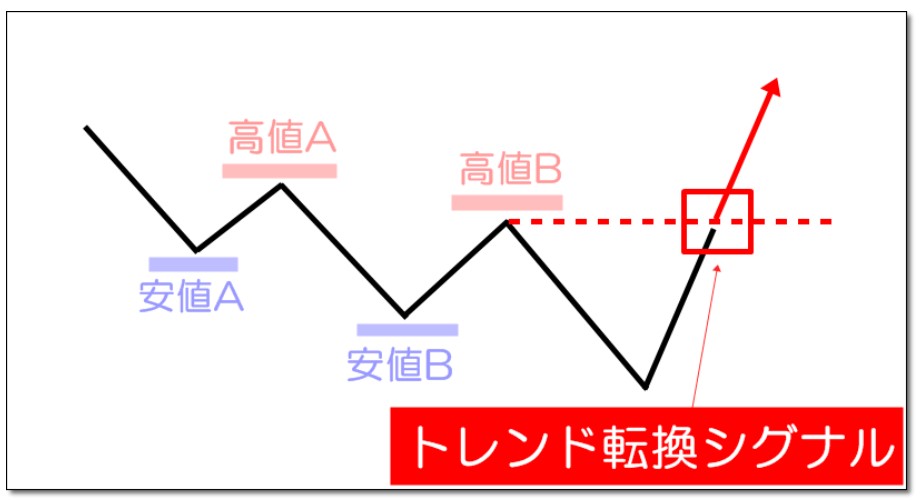
Once a clear trend is identified, you should follow that trend (trend following) until a reversal signal appears.
In particular,FXtends to sustain trends longer than other markets like stocks or futures, making this the most important part of Dow Theory.
For details on trend reversals, see the following article. ⇒【How to identify trend reversal and continuation signals using lower lows and higher highs】 |
Next, let’s confirm what a trend actually is.
FX's three market conditions — Uptrend, Downtrend, and Range
FX has three market conditions: uptrend, downtrend, and range.There are3
To win at trading, you need to know what the current market condition is.
Dow Theory defines these three markets under the following conditions.
What is an Uptrend?
It refers to a state where highs and lows are gradually moving up.
Specifically, an uptrend is confirmed when both lows and highs are rising.
Now, please look at the illustration.
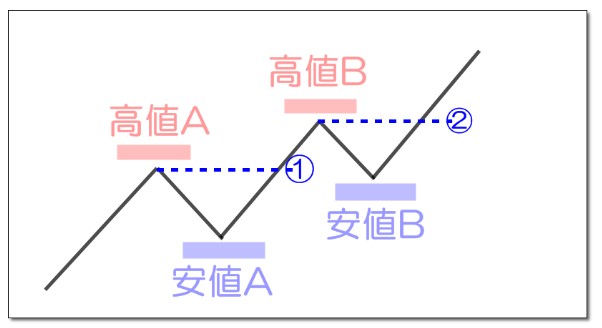
If both highs and lows are rising as shown, that’s an uptrend.
Dot line ① ... Uptrend confirmed
Dot line ② ... Uptrend continuation confirmed
During an uptrend, entry is a buying opportunity.
Downtrend is when highs and lows are moving down.
More precisely, a downtrend is confirmed when both highs and lows are falling.
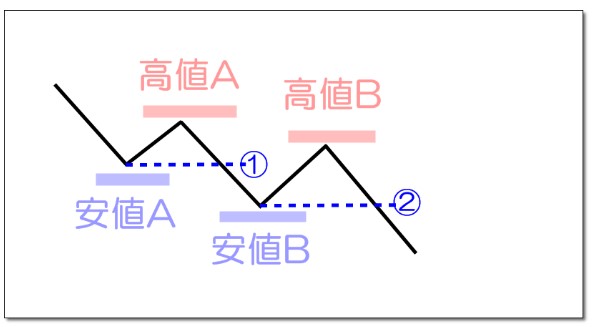
Dot line ① ... Downtrend confirmed
Dot line ② ... Downtrend continuation confirmed
In a downtrend, entries are made on the selling side.
From technical analysis to boost trend-following win rates, all techniques are packed into the following article. ⇒【FX Trend-Following Methods大全 — Master Trend Following in One Article】 |
Definition of a Range Market
A range market, also called a choppy market or box market, is where selling and buying are balanced, and prices move within a set range.
Now, please look at the illustration.
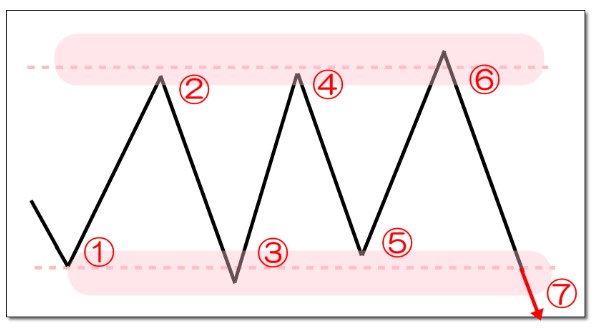
Looking at this, you can see price oscillating within a fixed range.
Please review the diagram again above.
① line rebounds ⇒ ② high line drops ⇒ ③ rebounds near the recent low
At this stage, you might suspect a range, but it’s not certain yet.
④ again rebounds near the recent high... this confirms a range.
⑤ rebounds twice at the bottom, so consider buying around this area.
⑥ rebounds twice, so consider selling around this area.
⑦ break... the timing of the break is uncertain.
A method to tackle range markets is explained in detail in the following article. ⇒【Two FX Trend-Following Methods to Easily Conquer Range Markets】with clear explanations. |
Entry Points in a Trend Market
Now that Dow Theory is somewhat understood, let’s introduce where you can actually enter.
Remember Dow Theory ⑥: “Trends continue until clear reversal signals appear.”
“Once you can confirm a clear trend, you should follow the trend until a reversal signal appears.”
Now, please look at the illustration.
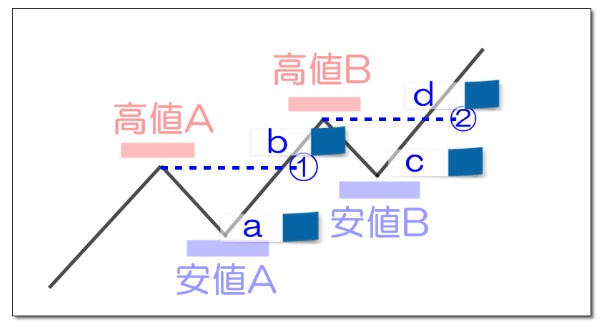
First, explain abouta~d.
a.Lows are rising, but highs have not been updated yet, so this is not an uptrend. Therefore, no entry here.
b.Lows rise and the line of dotted1is breached. Here the uptrend is confirmed. Break of dotted①allows a buy entry at that point.
c.Since both highs and lows are rising, this is a clear uptrend. After a rebound confirmation, enter buying. This is commonly called a dip-buy.
d.Highs are updated within an uptrend, confirming continued uptrend. Break of dotted②allows a buy entry.
Let’s summarize the entry points from the diagram above.
・Sticky noteb,Sticky noted⇒
・Sticky notec⇒In-uptrend adjustments (to A low) for dip-buy entry
Fundamentally, the entry points above are the basics of trend-following entries. In particular, notecis considered the quintessential dip-buy entry.
Conclusion
There are many trading styles that aim for small losses and big profits, but trend-following clearly demonstrates the largest profit potential.
To fully understand trend-following, Dow Theory is essential.
In particular, the following three things are important.
Everything is reflected in market prices
There are three kinds of trends
Trends continue until clear reversal signals appear
Be mindful of Dow Theory’s definitions of trends as you look at charts.
Your trading skills will undoubtedly improve.
If you’d like to read more articles, please check【Aiku’s Blog】.