2026/5/16 Dollar/Yen, Gold, SP500, and Nikkei 225 environment
『Trend Line Pro 3』Page is under construction
『World Standard MA Pro 3』Page is under construction
To make the chart easier to read, the chart scale has been reduced.
Please observe how ‘Line’ and ‘MA’ function as ‘support/resistance’.
If you found it helpful,
a ‘Good?️’ or a ‘Heart❤️’ would be encouraging.
For behavioral verification, we provide weekly movement videos of the USD/JPY.
USD/JPY
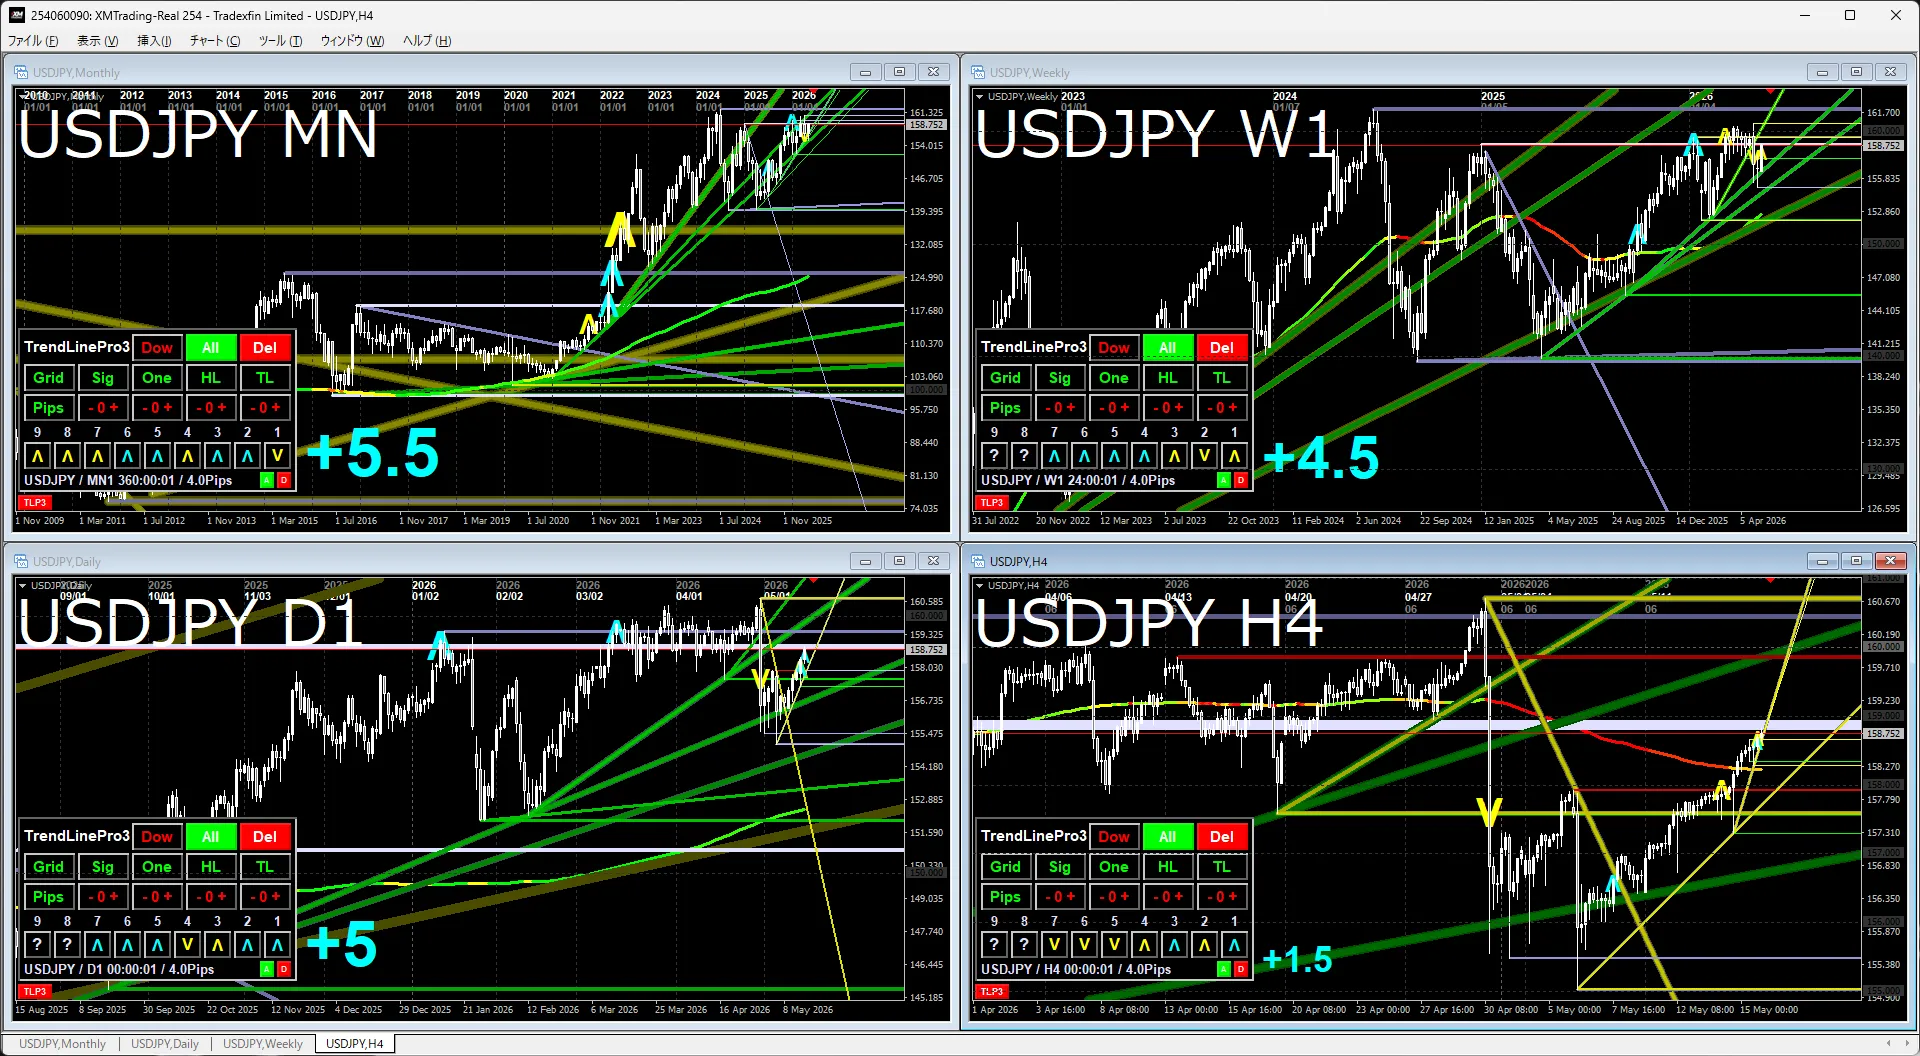
Monthly & WeeklyThe latest high was broken, and next we seem to test the monthly high.
Daily & 4-hourThe thick white horizontal line is in a state where a breakout is easy, so you may view this as a continuation of the ascent. If by any chance the white horizontal line holds and pushes it lower, you should watch for a decline.
Gold
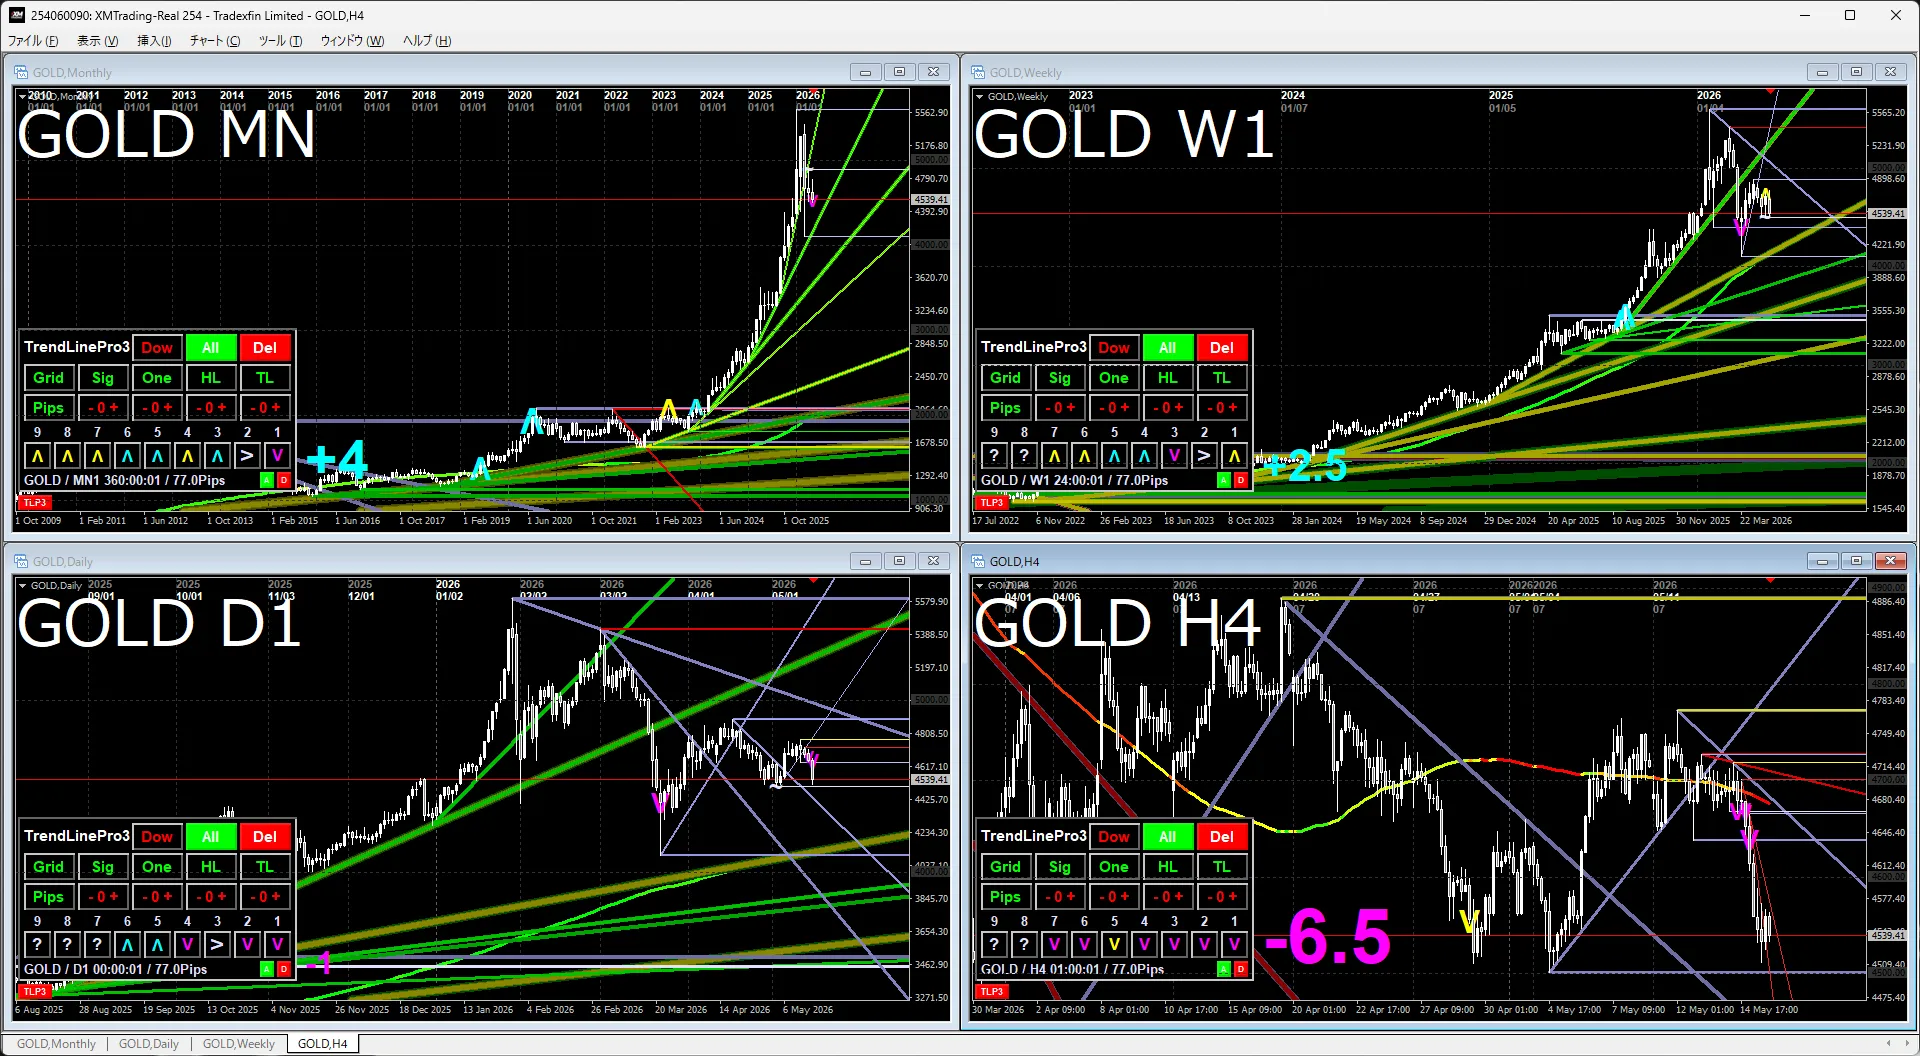
Monthly & WeeklyAttention is on currency value declines, and gold remains in a strong buy stance. Money is flowing into equities, so it may stay within the weekly triangle until that settles.
Daily & 4-hourIn the 4-hour chart, many levels are in a downtrend, and if it breaks the recent low on the daily chart, the downward move may continue for a while. In the near term, observe whether it breaks 4500 or around 4800.
S&P 500
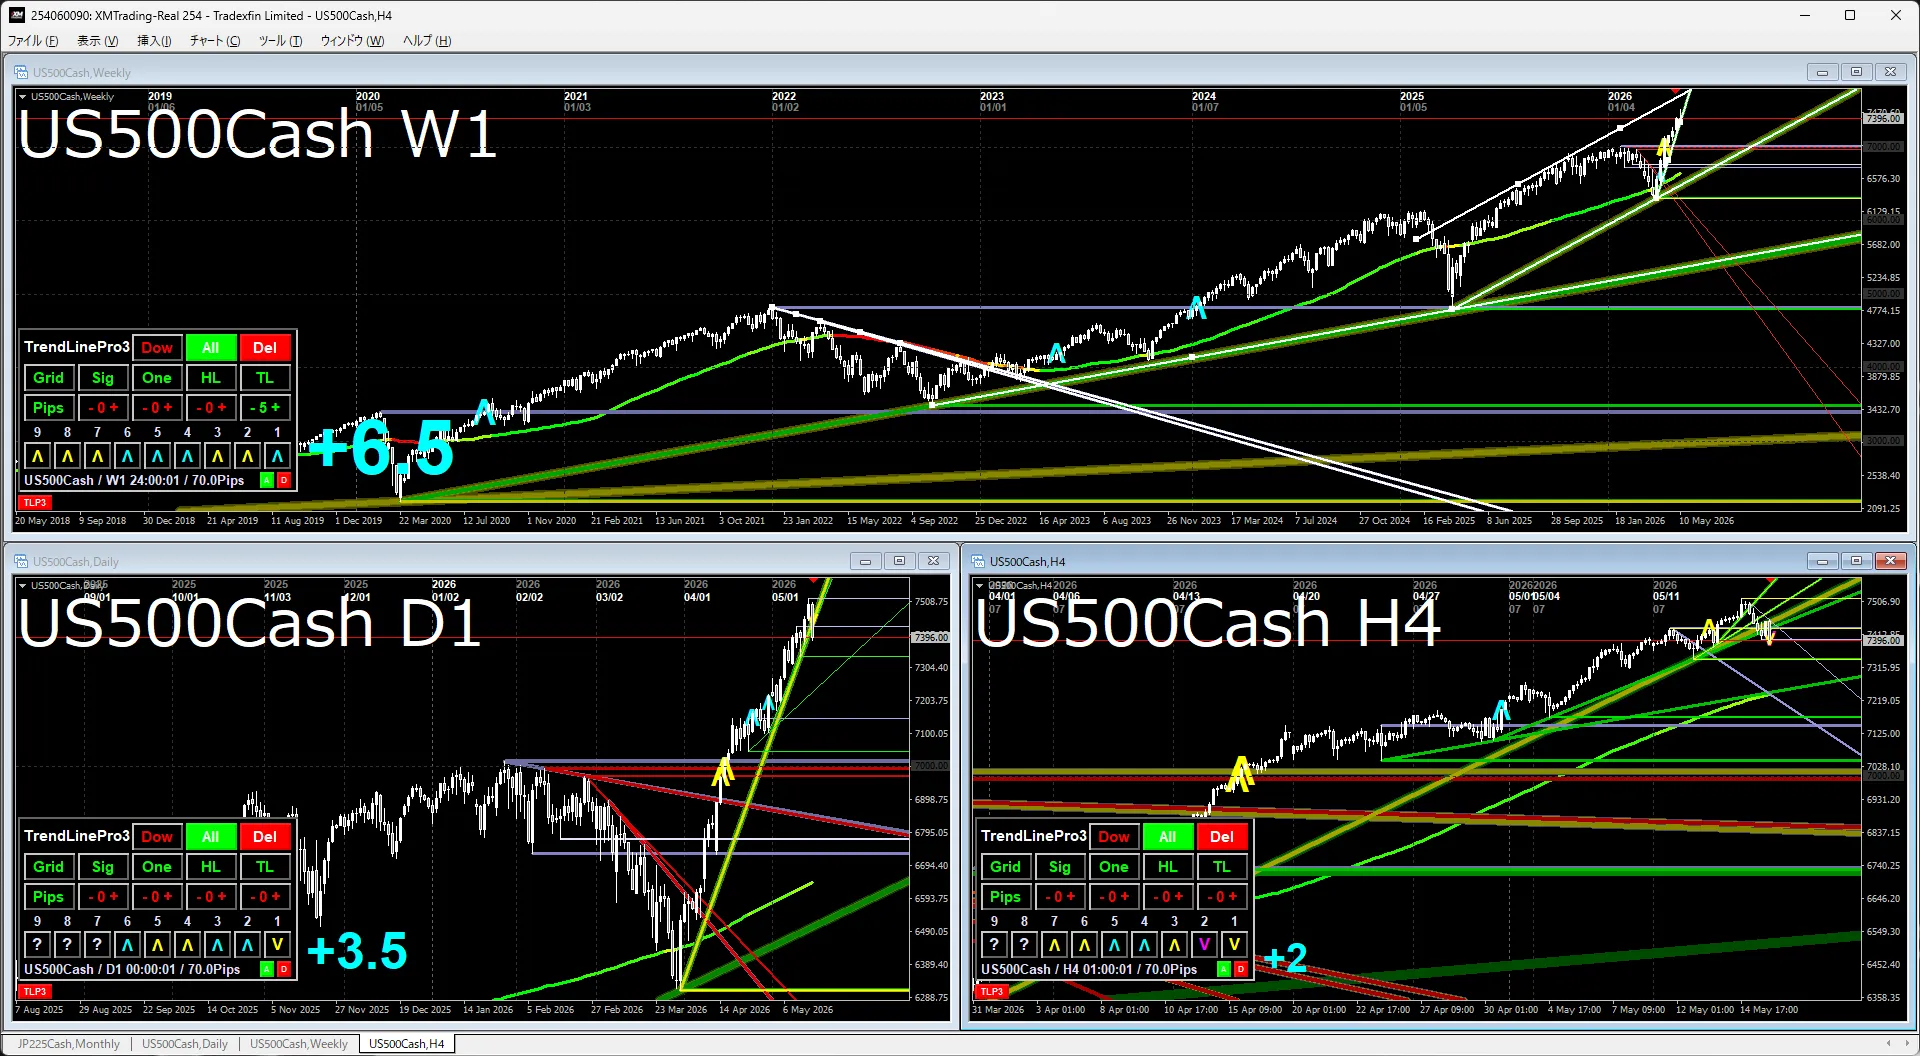
Monthly & WeeklyRecent highs have been exceeded and an uptrend continuation is confirmed. By cultural context, buying pressure is common.
Daily & 4-hourIn the near term, the upper boundary of the channel and the decline from around 7000 to around 6300, around 7700, are key levels to watch. Since the trendline is breached, a period of consolidation may occur.
※ In the weekly chart, a panel button is used to create a white channel line.
Nikkei 225
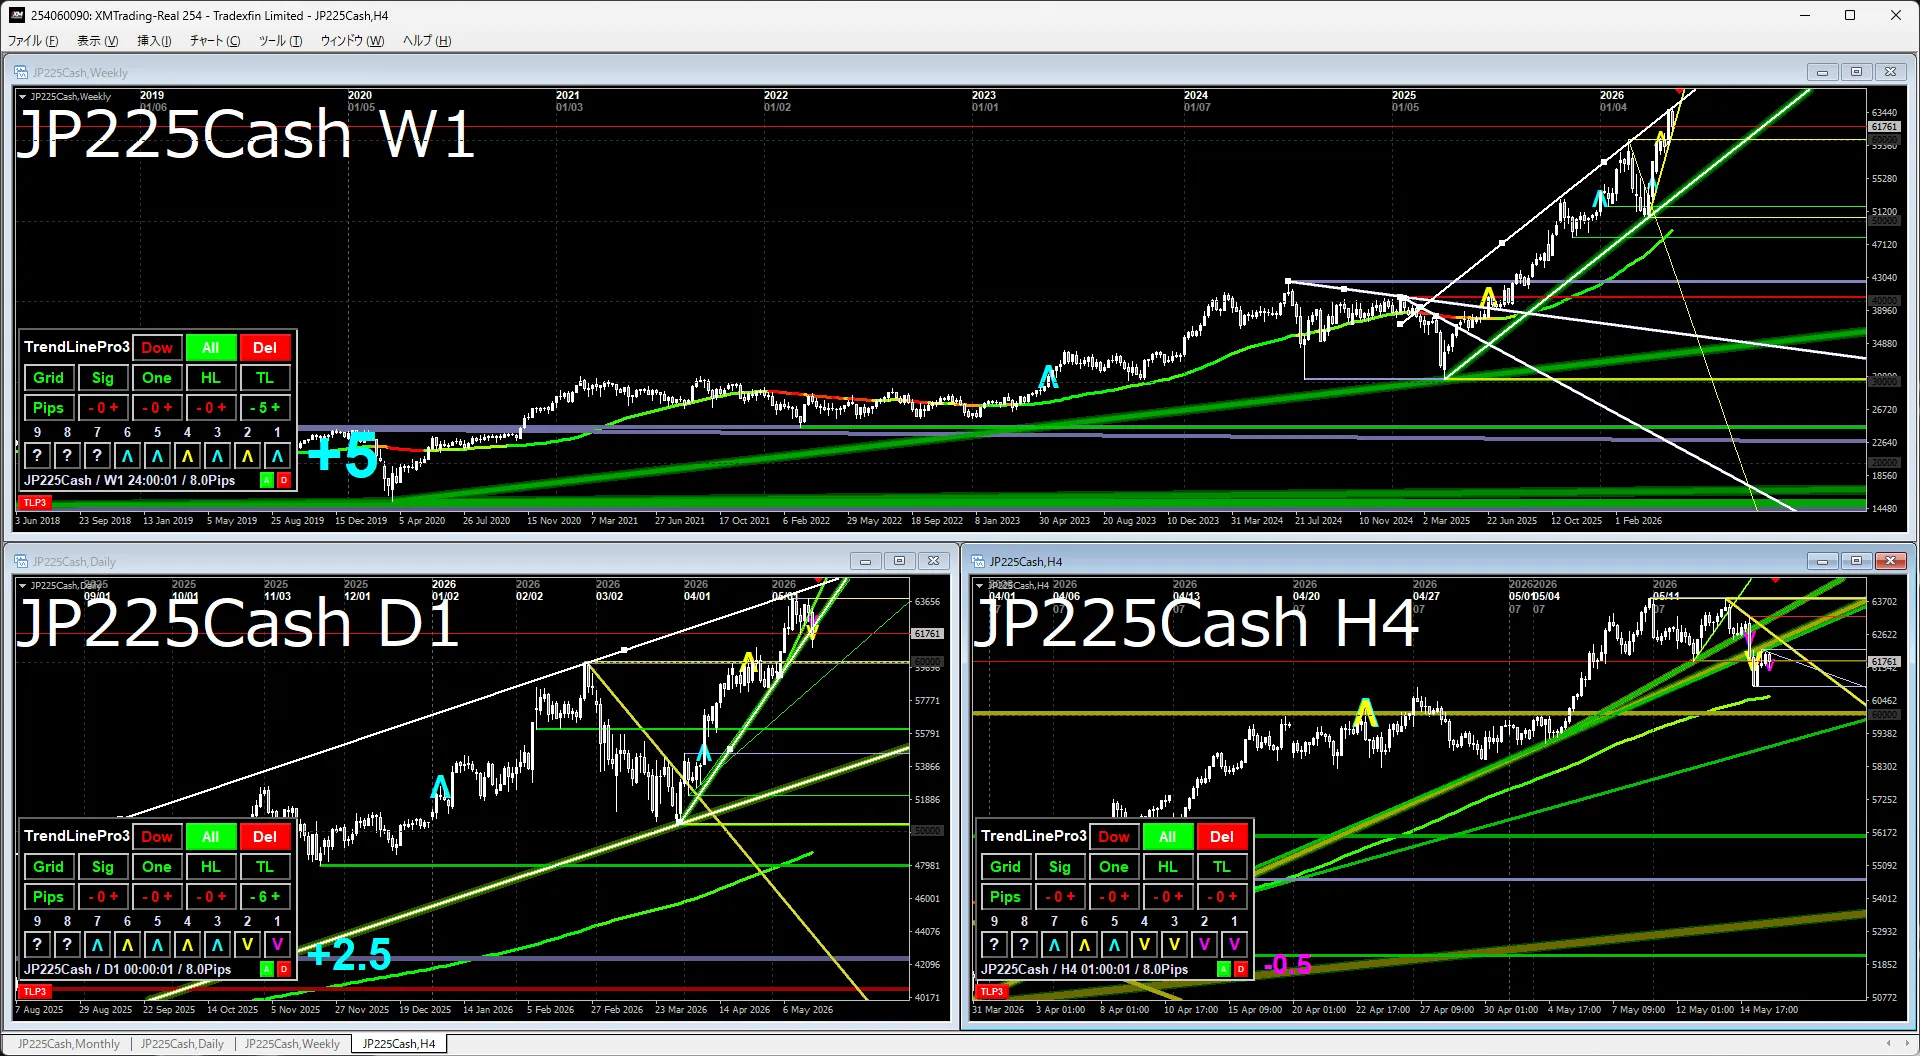
Monthly & WeeklyWith a new high, the trendline has been redrawn, and the recent rise clearly indicates ongoing upward momentum. In the near term, it appears to be pulling back near the channel line.
Daily & 4-hourHaving begun to break below the trendline, this rise at this angle may calm. It tends to be a watchful environment for now, but how it turns is not yet clear on the chart.
※ In the weekly chart, a panel button is used to create a white channel line.
The attached image indicators use the following indicators.
If you are interested, please take a look.