

2026/3/21 Dollar/Yen, Gold, SP500, and Nikkei 225 Environment

The indicator in the attached image uses the indicators above.
Primarily, please observe how the lines and MA are functioning as ‘resistance’.
For verification purposes, we provide a weekly USD/JPY price movement video.
USD/JPY
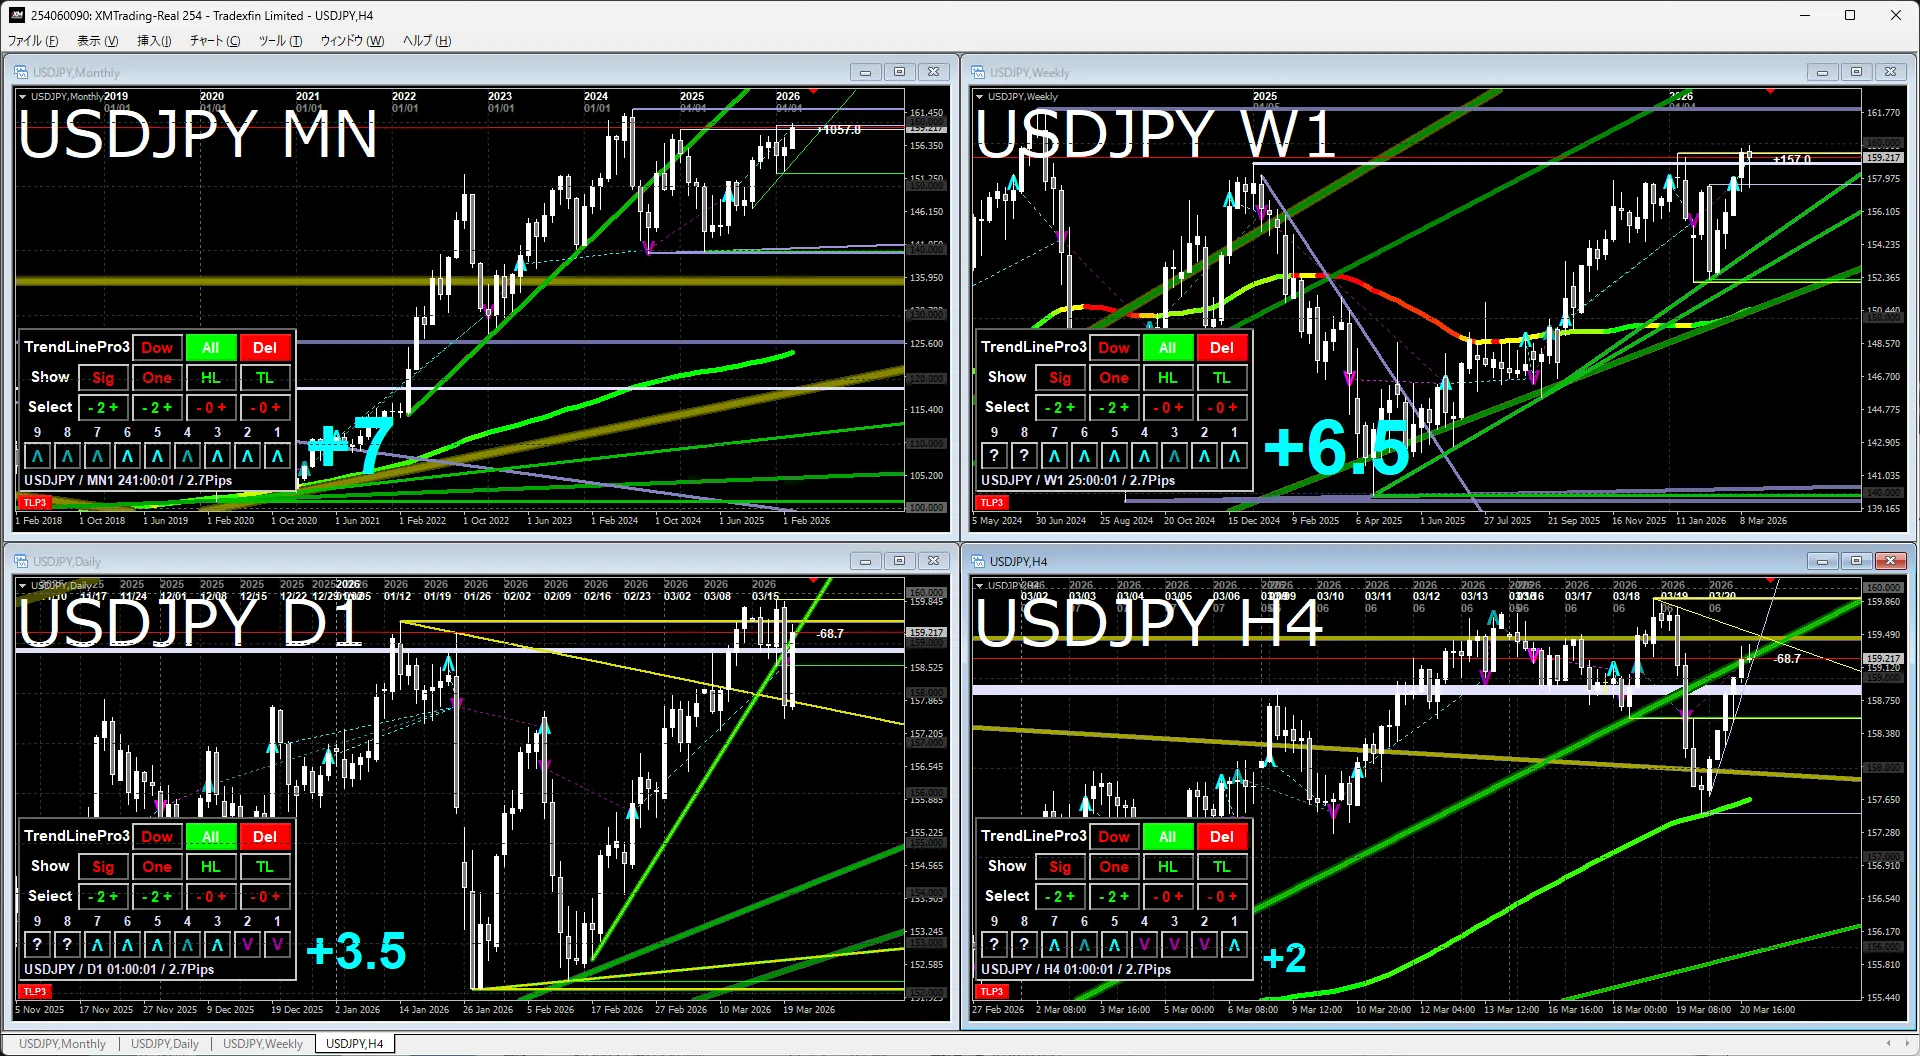
Monthly & WeeklyThe most recent sideways trend clearly showed continued upside movement. Next, it seems the price will test the monthly high.
Daily & 4-hourhas broken through a white horizontal line indicating a consolidation. A pullback is possible, but the upside remains in focus.
Gold
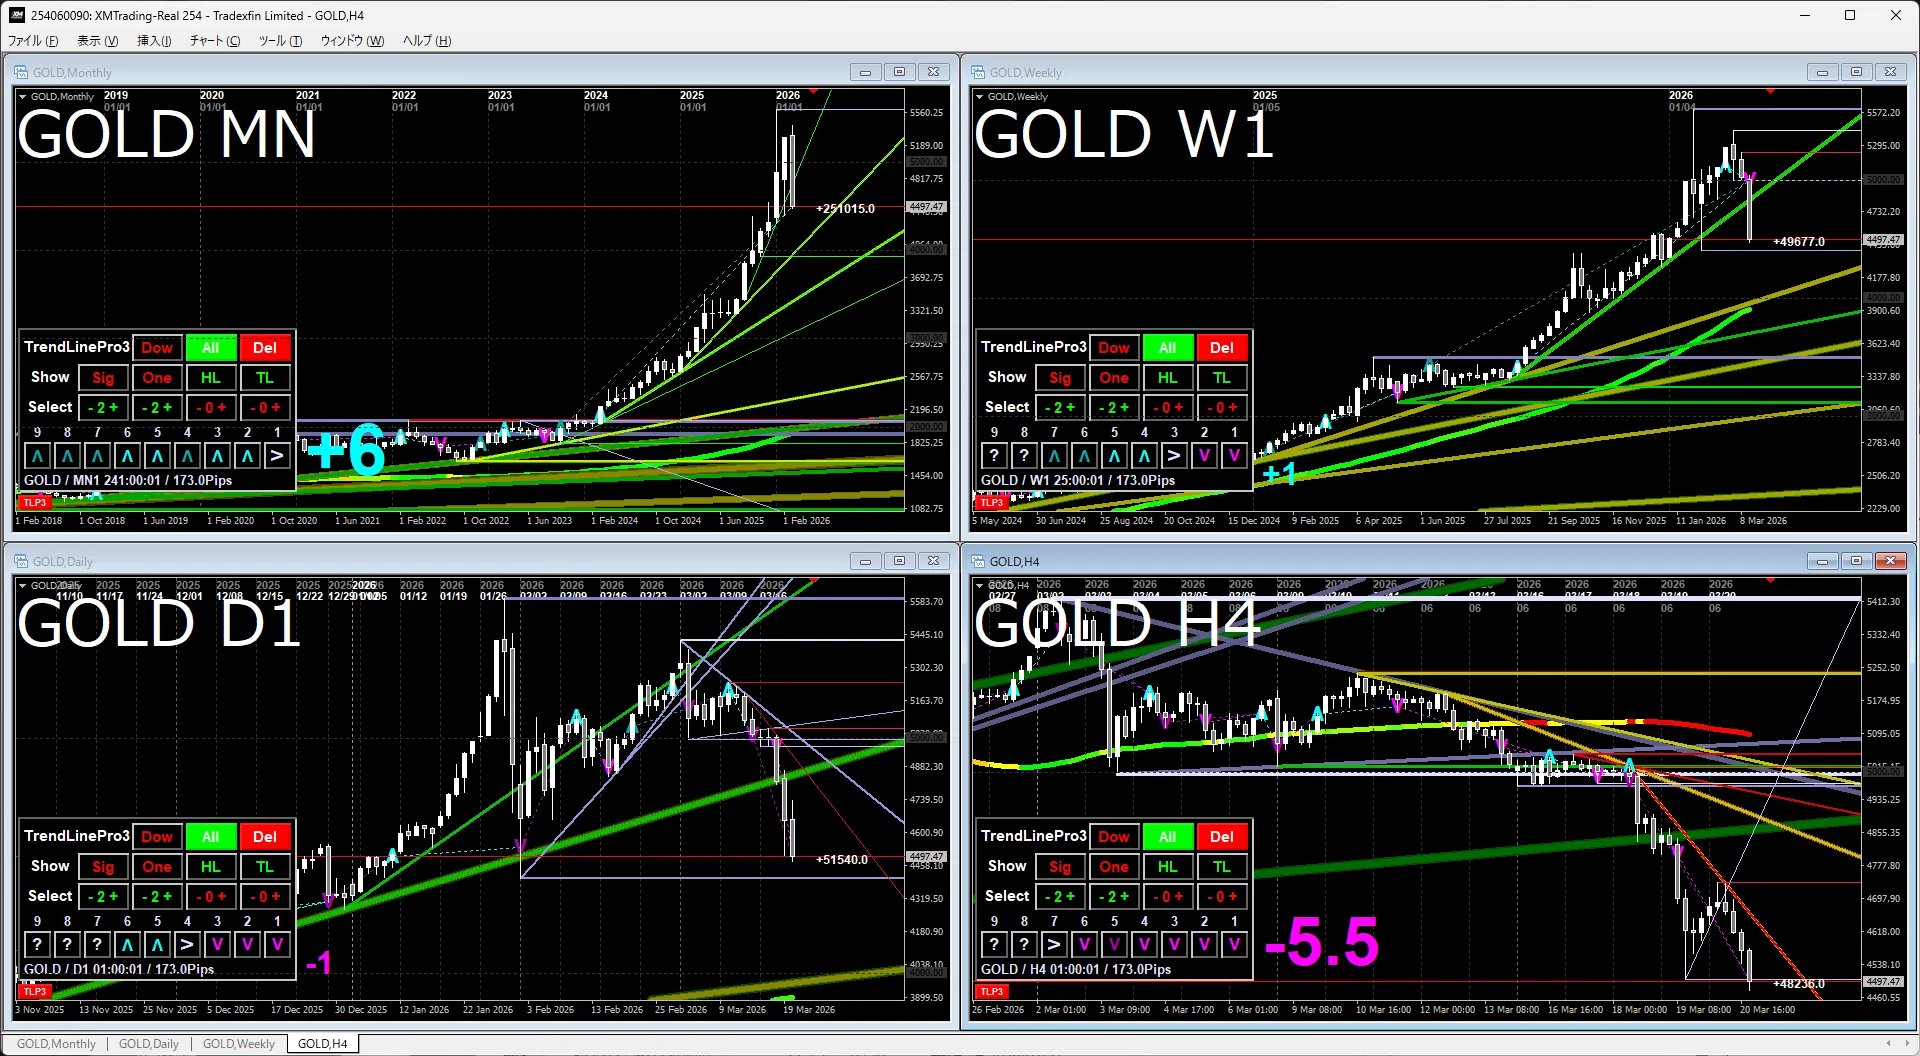
Attention is on currency weakness, and gold remains in a clear buy-the-dip stance, but it appears to have broken a nicely drawn trendline and entered a correction phase.
It has not been able to make a new high and is testing recent lows; if the level breaks, it will turn to test lower levels, but if it does not break, it may form a triangle consolidation.
Even if prices test the downside, we expect no extreme crash.
S&P 500
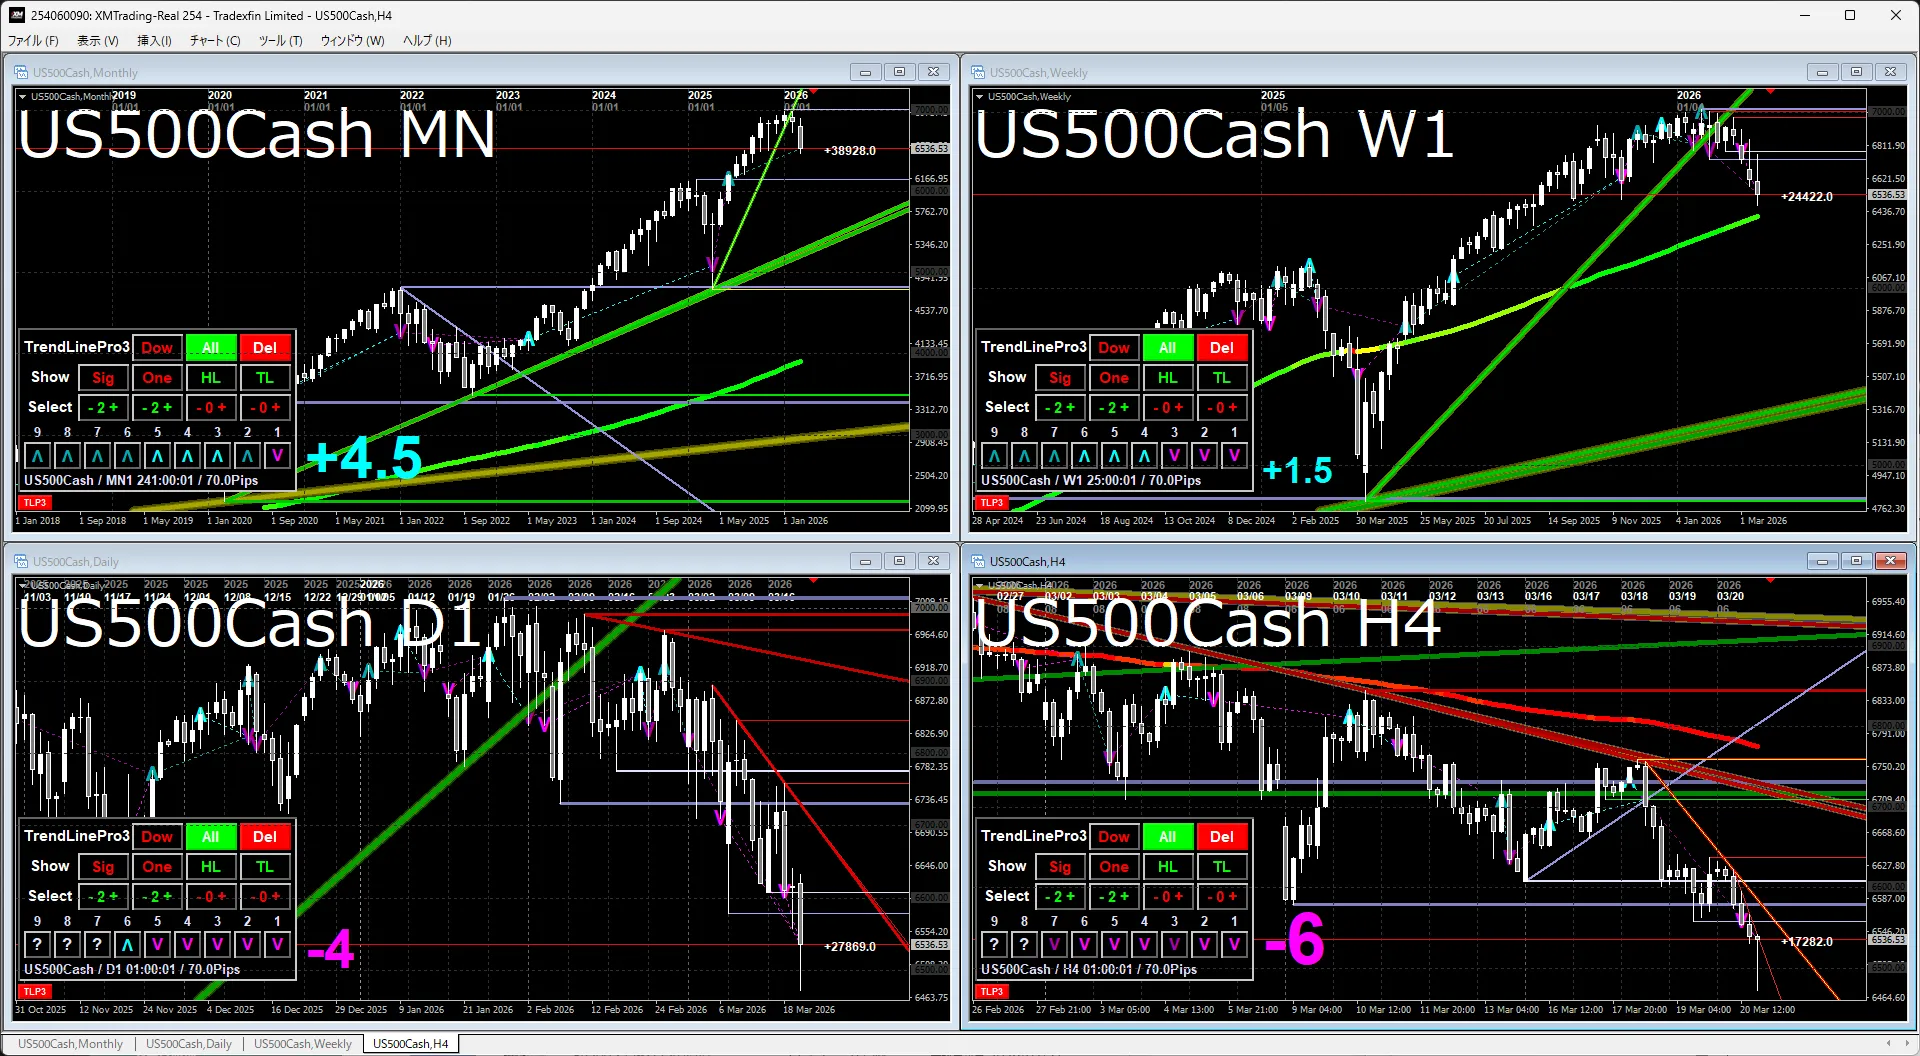
Monthly & WeeklyAfter a rebound from the trendline, it remains in an uptrend, but there is a possibility that it has entered a consolidation phase.
Daily & 4-hourThe score indicates a downbeat in the short term, and there may be some pullback toward the weekly MA, but personally I think the sideways trend will continue.
Nikkei 225
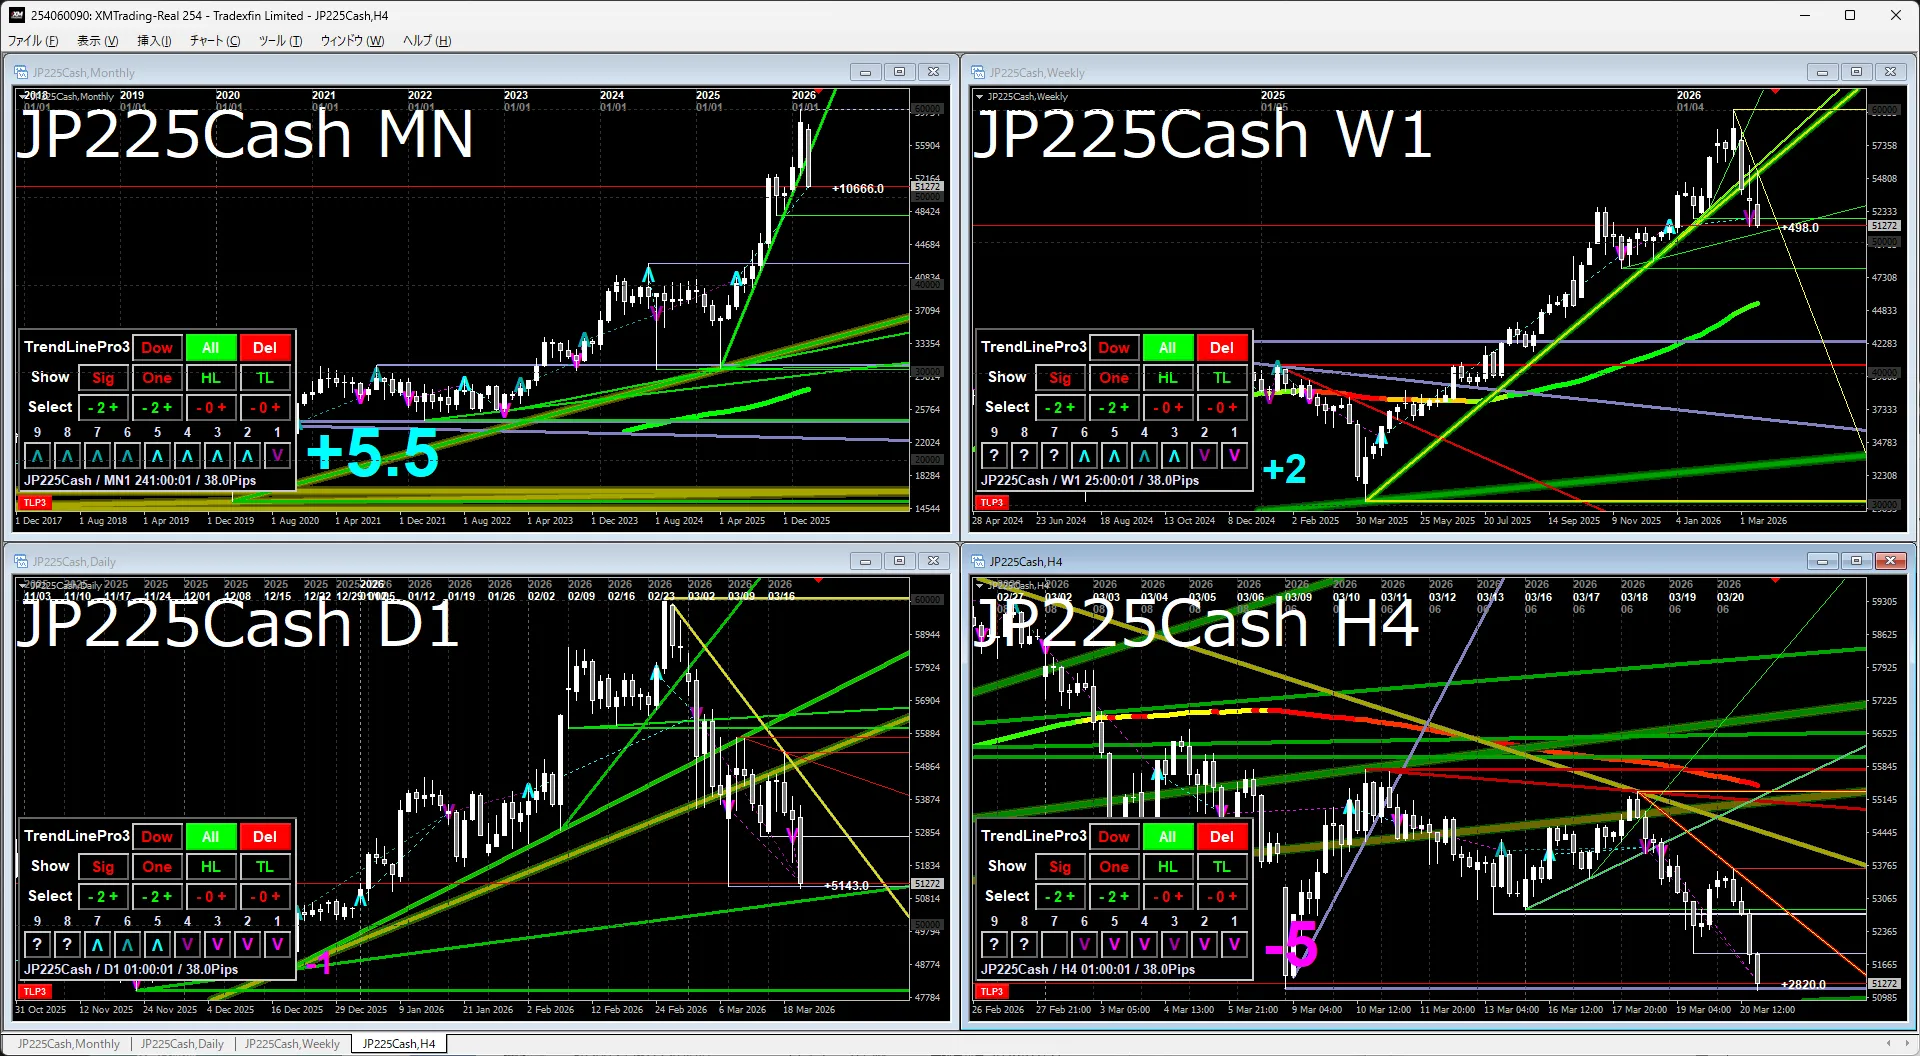
Monthly & WeeklyThe trendline has been cleanly broken, and given the MA relationships, there is more downside risk than in the S&P 500, which is a bit concerning.
Daily & 4-hourThe price has broken the trendline and is testing the most recent low on a retest; if it breaks down, downside pressure increases. It may be prudent to consider a larger possible pullback.
The indicator in the attached image uses the indicators below.
If you are interested, please take a look.
Although the button has appeared, there is no continuation.
We will post brief advance information about a few products.


Is it OK?