2026/4/18 Dollar/Yen, Gold, SP500, and Nikkei 225 Environment
“Trendline Pro3”Test Release
“World Standard MA Pro3”Test Release
The indicator in the attached image uses the indicators mentioned above.
Note: The product page has not been created yet.
Note: The product itself is complete and has been uploaded.
Please check how the “Lines” and “MA” function as “Support/Resistance.”
For verification, we provide a weekly video of USD/JPY price movements.
USD/JPY
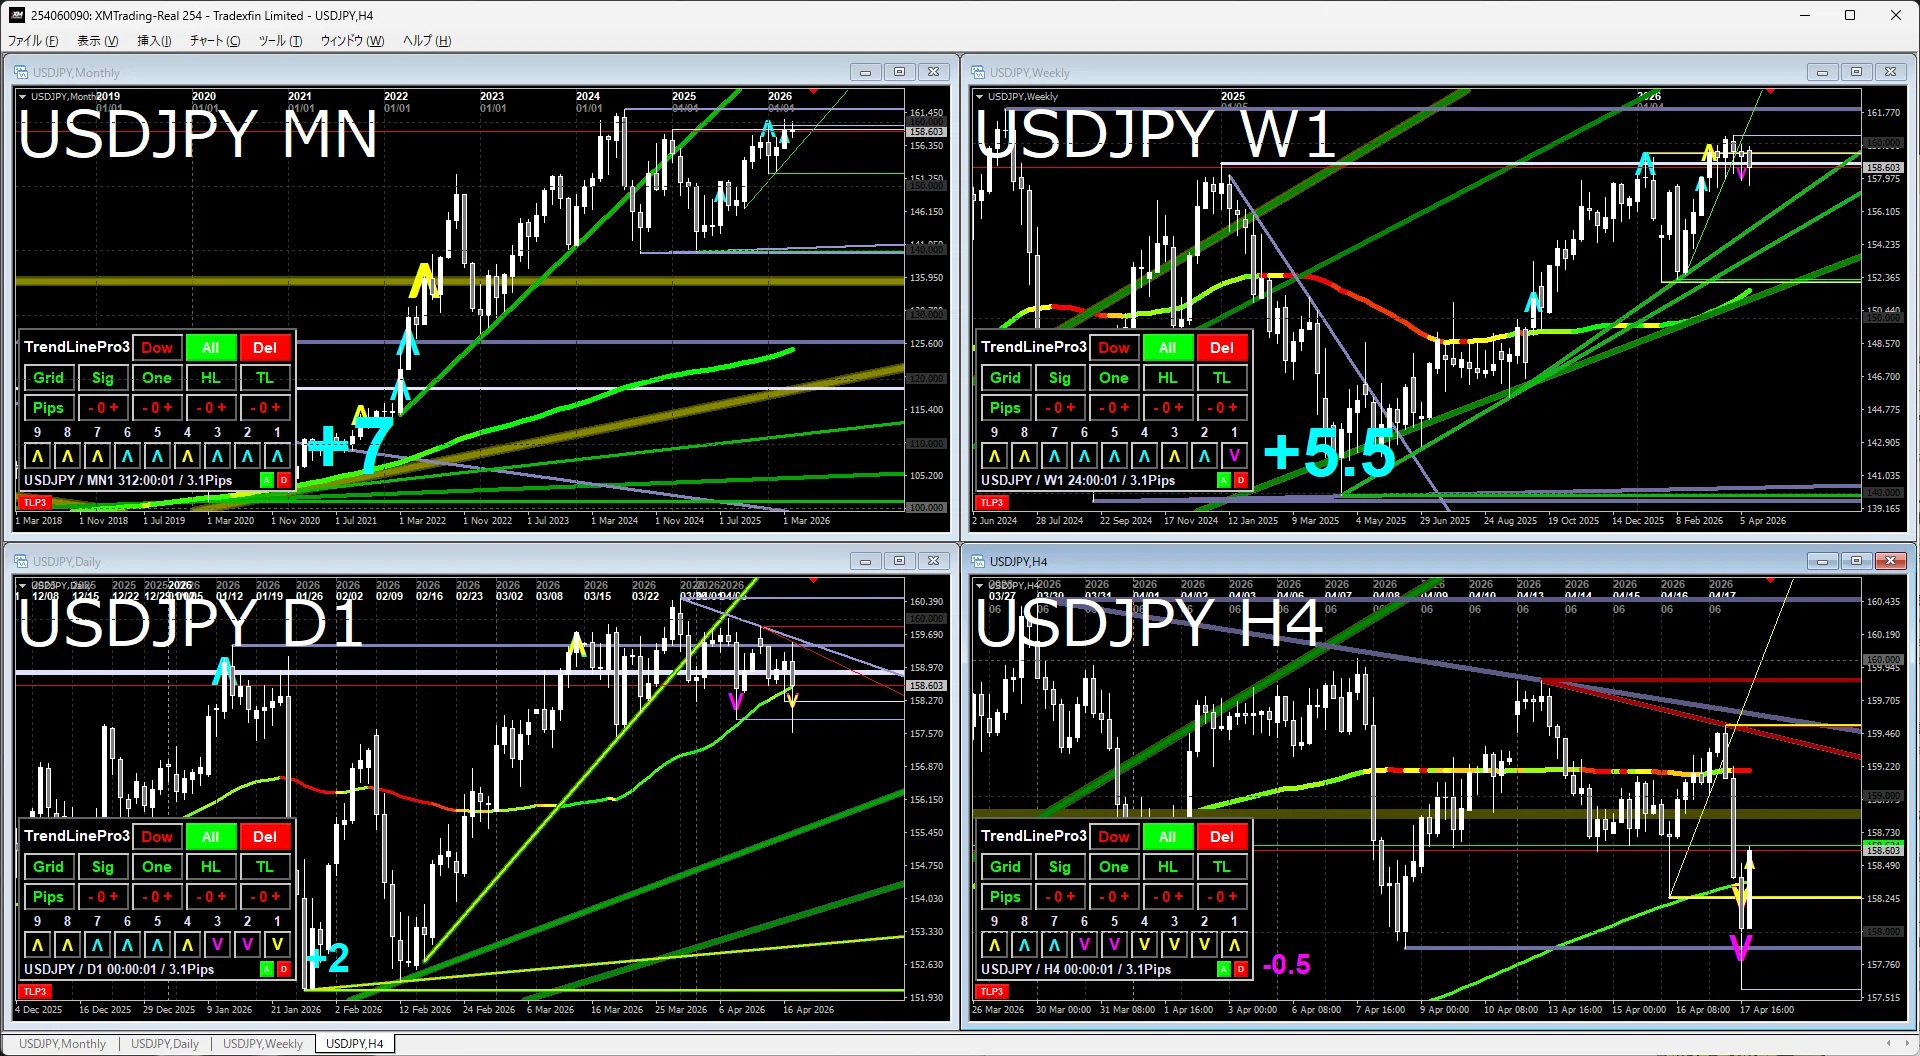
Monthly & WeeklyThe recent sideways trend clearly shifted to an upward continuation. It looks like it will test the monthly high next.
Daily & 4-hourIt is sideways. There is a possibility of a brief pullback, but the shape tends to favor a flag-like rise.
Gold
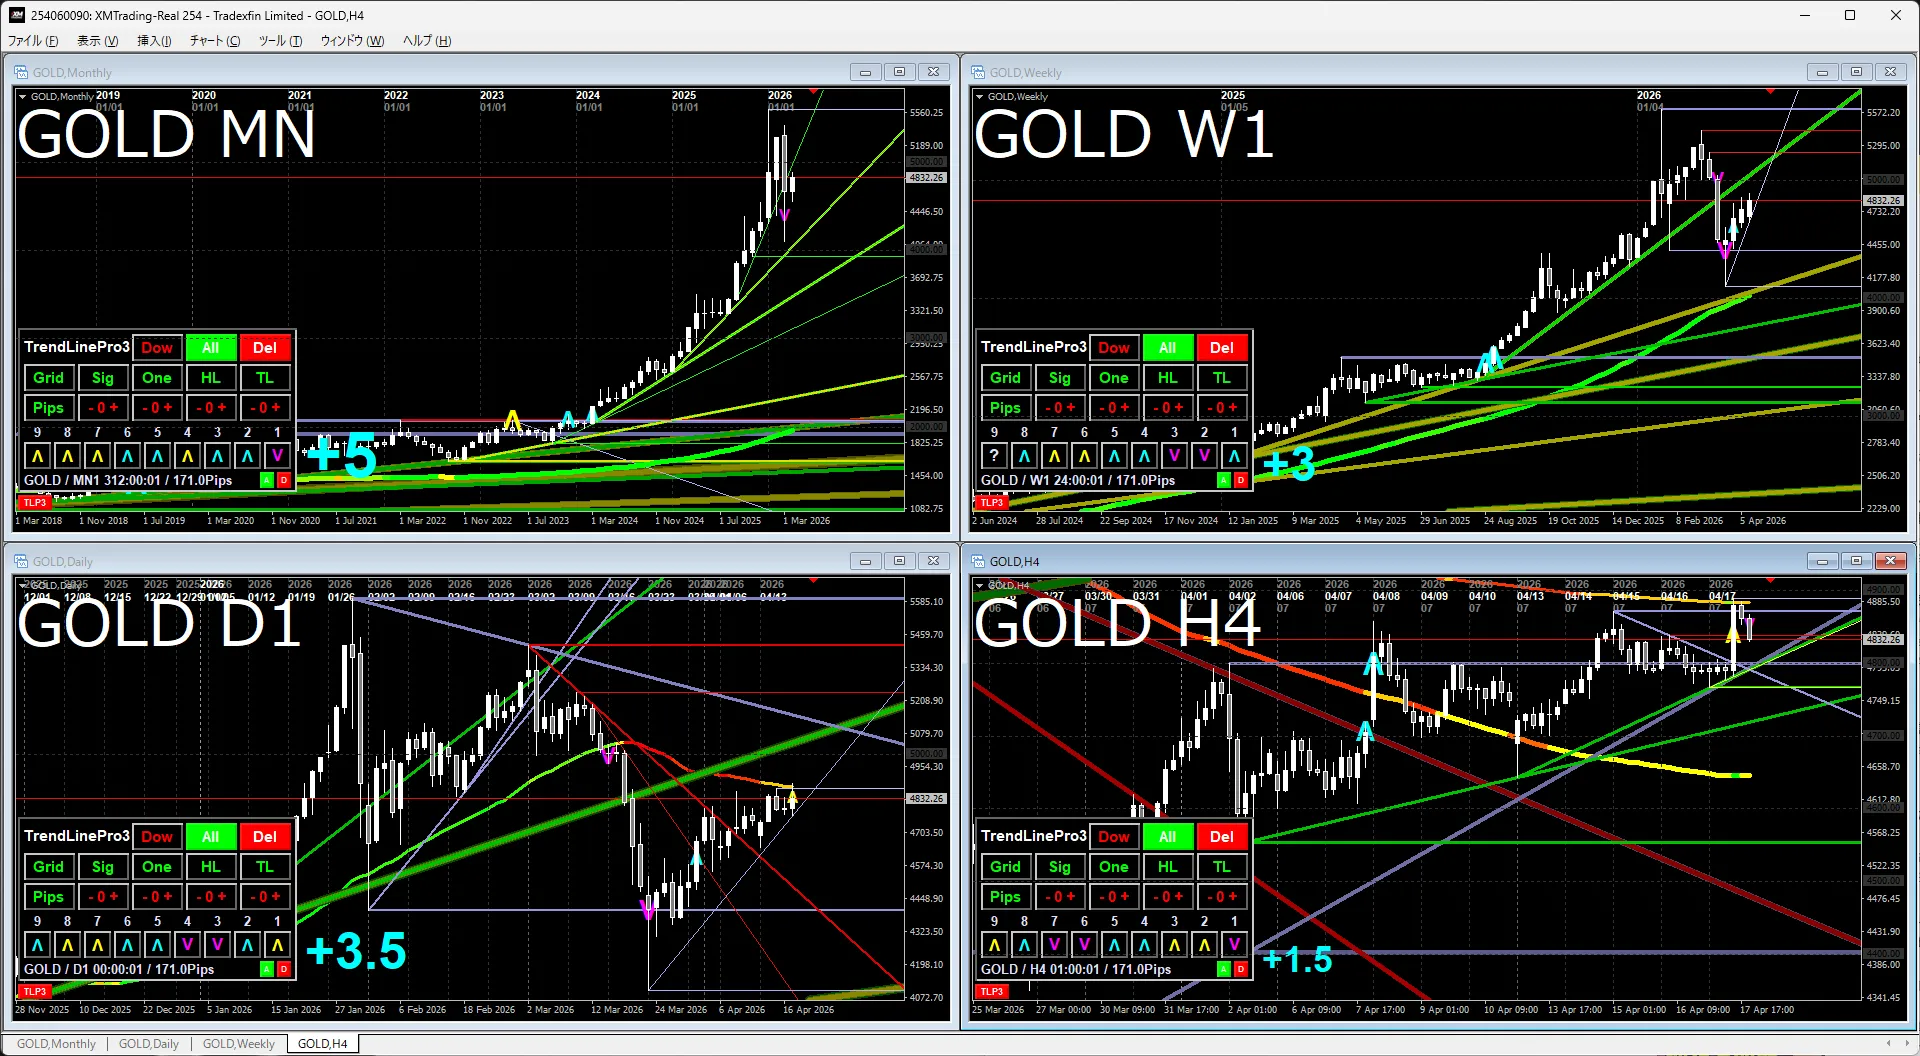
Monthly & WeeklyAttention is focused on currency depreciation; gold remains a clear buy, though it is in a corrective phase.
Daily & 4-hourLow and high are both trending lower; recently a strong lower wick, and the outlook may stay cautious for a while.
S&P 500
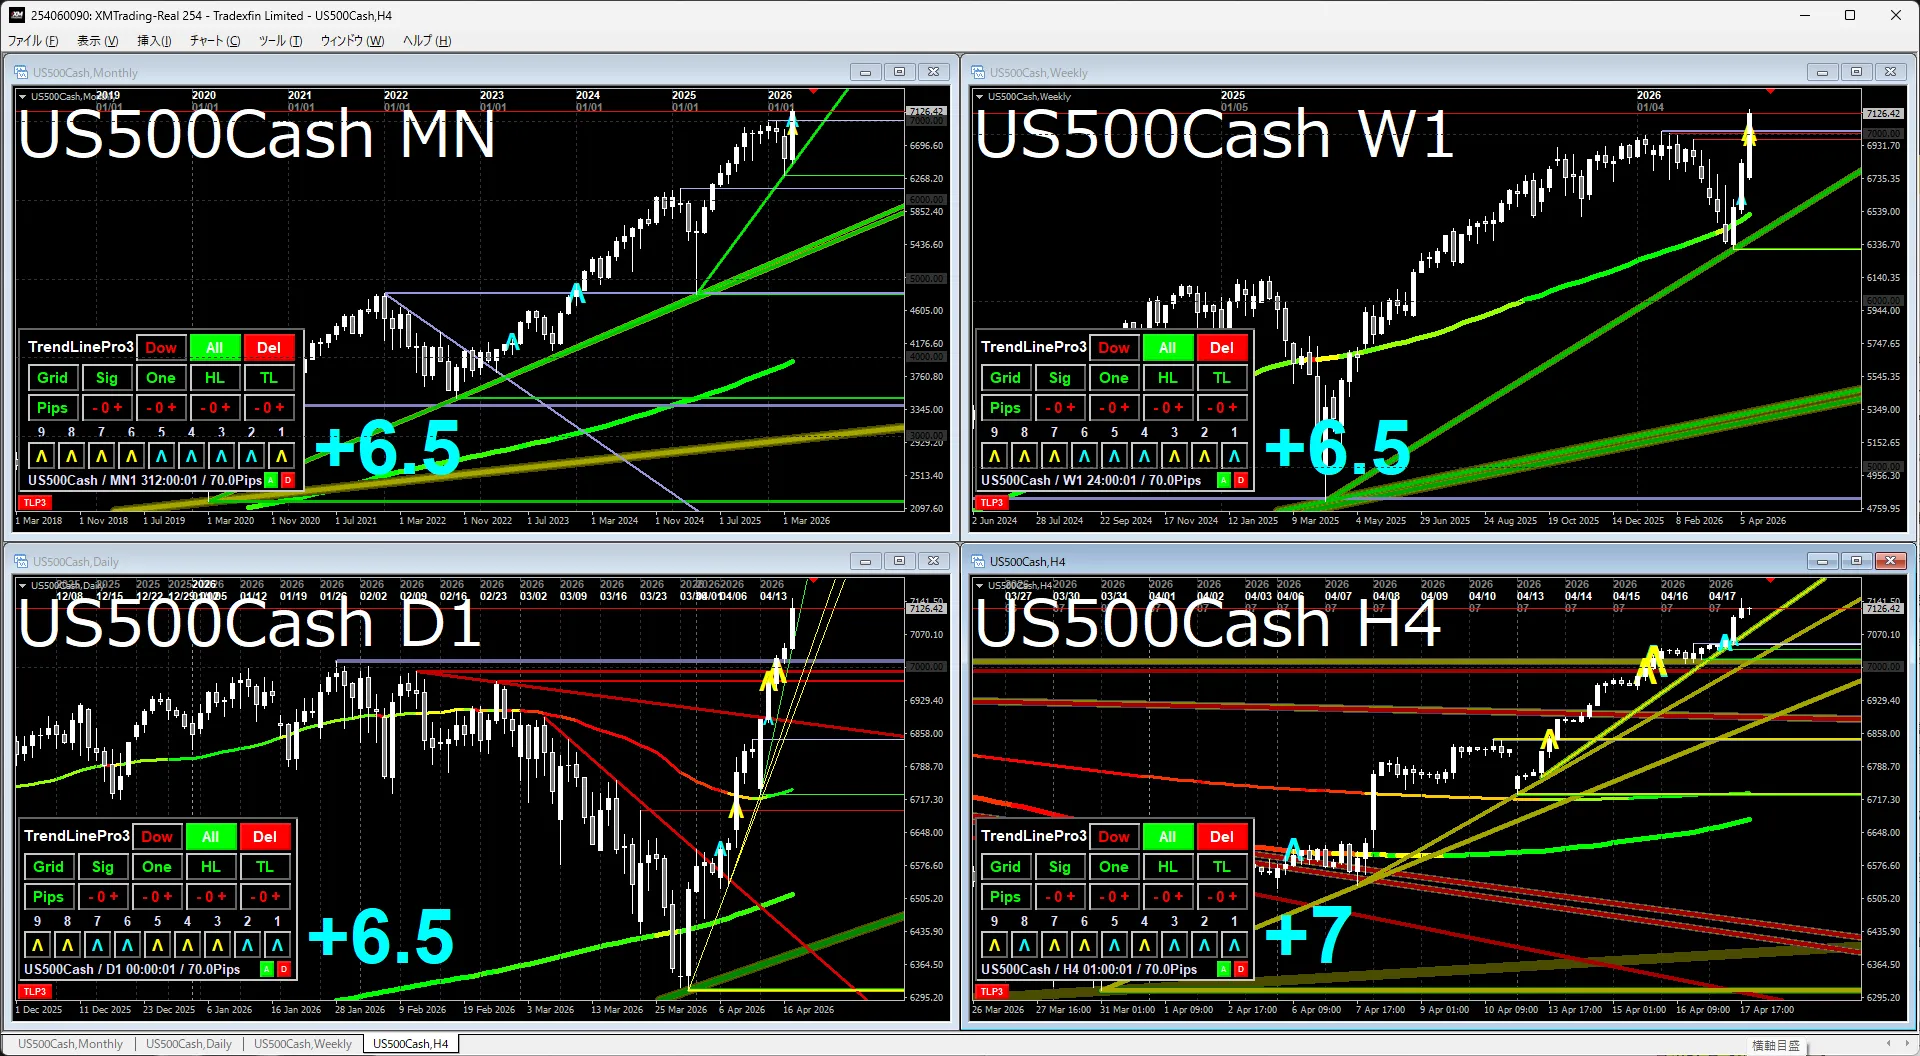
Monthly & WeeklyHas surpassed recent highs and continues to rise. Culturally, buying tends to come in.
Daily & 4-hourMA deviation is a concern, but the environment remains conducive to further gains.
Nikkei 225
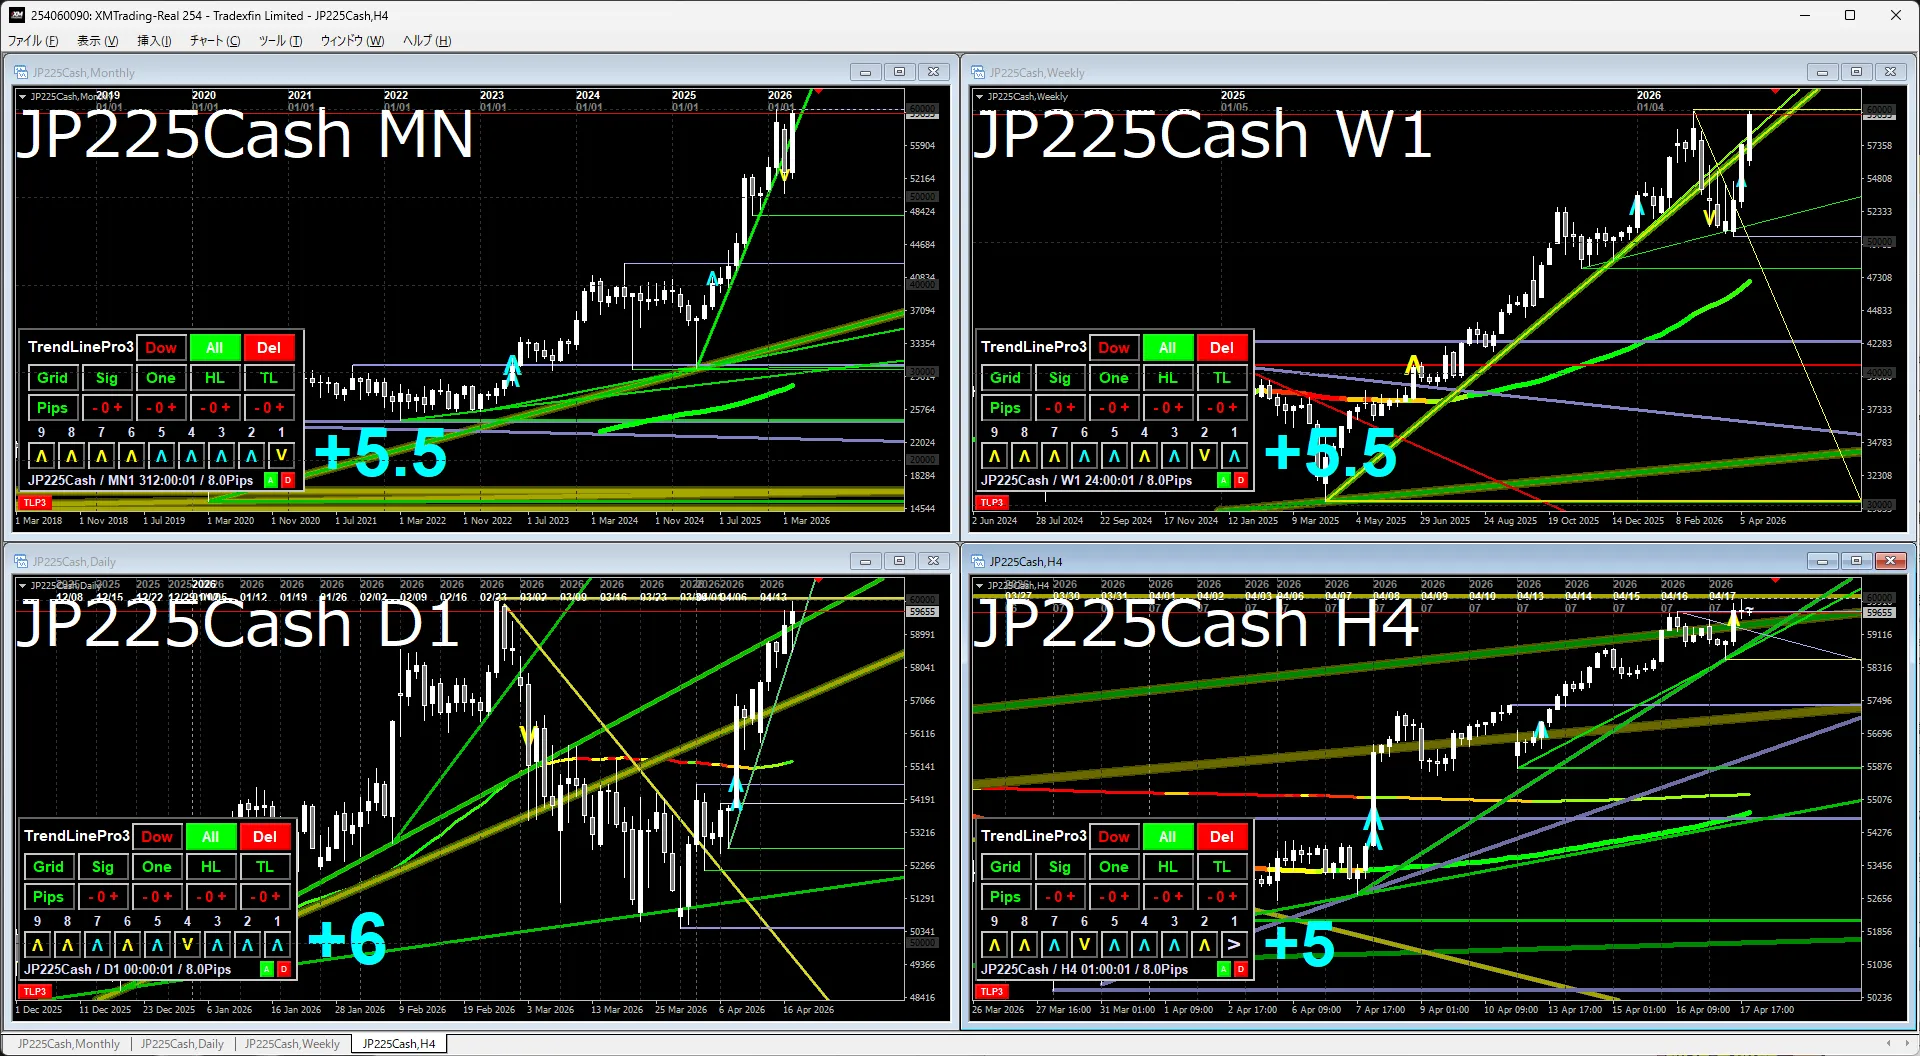
Monthly & WeeklyPulled back to near recent highs after a pullback. Culturally, prices tend to be sold after hitting highs.
Daily & 4-hourReached the recent high; the next direction is uncertain. It may be better to wait for a break above the high or observe.
The indicator in the attached image uses the indicators listed below.
If you're interested, please take a look.
“Trendline Pro3”Test Release
“World Standard MA Pro3”Test Release
↓ I’ve added a button, but there is no continuation.
I’ll add a brief aside for a moment.