
A winning FX trader's focus: highs, lows, and environmental awareness

This article explains in detail“Why do successful FX traders pay attention to highs and lows? | The Power Relations of the Market””in detail. |
Understand the meaning of highs and lows
As for the meaning of the words, highs and lows are defined as follows.
High = the highest rate over a certain period
Low = the lowest rate over a certain period
If you put it plainly, that’s exactly what it is. Simply the high value and the low value.
Below I have illustrated highs and lows with a diagram.

It’s a shape you often see in FX books, isn’t it?
Next, in the following section, we will explain why highs and lows are created.
The waveform created by highs and lows
Using those highs and lows, you can see a waveform, i.e., a pattern of movements.
The market goes up and down; the top when it rises is the high, the bottom when it falls is the low.
The waveform can be checked in minute charts, time frames, or daily charts.
The longer the period, the larger the waveform, and the greater the difference between high and low.
Specifically, the waveform is represented in diagrams like the following.
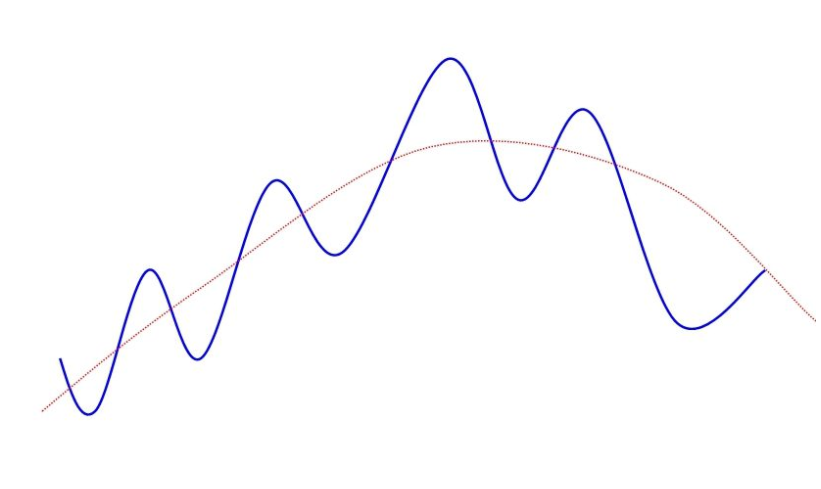
This diagram is also a commonly seen waveform.
As shown, the market moves up and down, constantly forming a waveform as it progresses.
So, why does the market move while drawing such a waveform?
There are two main reasons.
First, there are buyers and sellers.
Second, what is bought must be sold someday, and what is sold must be bought back someday.
These two reasons create waveform patterns in the market.
You might think this answer is obvious, right?
However, if you properly understand these two reasons, you can gain insight into market psychology and crowd psychology on the charts, which is a very important point for trading.
Background for creating highs and lows (market psychology and crowd psychology)
Why do rates rise and fall while forming a waveform?
Let’s explain this while looking at the following diagram.
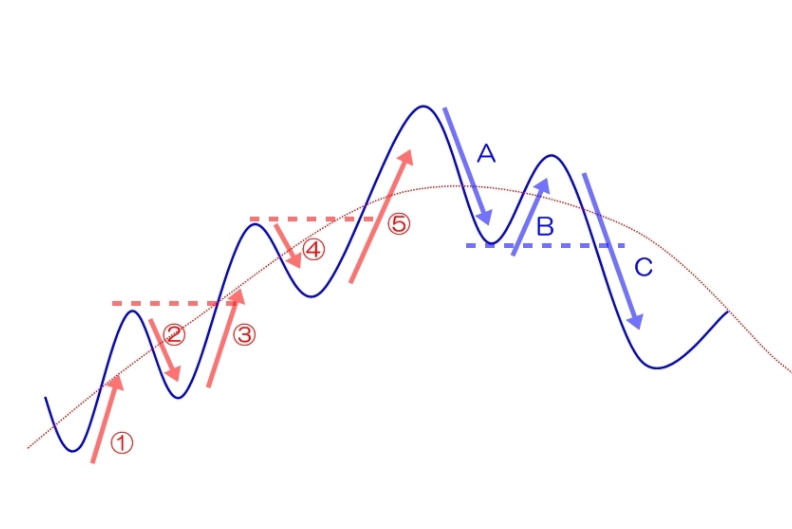
① Large-volume traders such as institutional investors begin buying, driving prices up. It’s like the start of a game.
② Some traders take profits on long positions and contrarian traders enter, causing a price adjustment and decline.
③ Traders notice big buying and enter long positions; furthermore, contrarian traders who entered at step ② cut losses, pushing prices higher. Observing this rise, other traders buy, and the rate surges sharply.
④ As in step ②, partial profit-taking and contrarian traders enter again, and prices adjust downward.
⑤ Beginner traders who missed the upward trend think prices will rise further, rush to create long positions, and enter.
〔A〕When the buying positions of beginner traders have sufficiently expanded, large traders such as institutional investors start taking profits and entering selling positions, initiating a price decline.
〔B〕Large traders have already started selling, but beginners who don’t notice continue to enter long positions.
〔C〕Large traders add more selling pressure, pushing prices down. The beginner traders who entered at 〔B〕 panic and dump positions, triggering a wave of stop-loss orders. This selling begets more selling, and prices drop rapidly. At this timing, mid-to-upper level traders short, accelerating the decline.
Environmental awareness using highs and lows
Thus, the waveform on the chart is the result of the buying and selling forces.
Therefore, environmental analysis means analyzing the market’s power balance between buyers and sellers, and in particular, highs and lows are important rates where the buying and selling forces have settled.
When the settlement of these buying and selling forces becomes the starting point, the chart’s waveform begins to form.
This is very important, so I’ll summarize.
〇 Environmental recognition is analyzing the market’s power balance
〇 Is it currently a buying market, a selling market, or neither? Analyze this.
In other words, highs and lows are the “settled values of buying vs selling forces” and the “starting points that generate the waveform.”
That is, you need to understand
How highs and lows are determined is explained clearly in the following article.
⇒【A method to definitively define highs and lows in FX! Swing highs and swing lows】
In environmental recognition, hints of whether the market is in a buying or selling phase are found in pullbacks and swing highs.
Highs and lows include normal highs/lows and pullbacks and swing highs; when performing environmental recognition, these two should be distinguished and analyzed.
For pullbacks and swing highs, see the following article for a clear explanation.
⇒【How to identify trend reversals or continuations: updating pullbacks and swing highs】
Notable highs and lows
Finally, let’s introduce the highs and lows that are getting attention on charts.
There are highs and lows, but actually a variety of time intervals (zones) focus on highs and lows.
In broad terms, understand the four main time-frame highs and lows below.
The highs and lows visible on the displayed chart (chart panel time divisions)
Recent highs and lows (recent division)
Candle high and low (daily, weekly, monthly chart divisions)
Highs and lows of the Tokyo, London, and New York markets (market-specific divisions)
Summary
Finally, a summary of the important points about highs and lows.
【What are highs and lows?】
High = the highest price in a given interval
Low = the lowest price in a given interval
【Waveform】
Market psychology and crowd psychology move prices, creating a waveform.
When a waveform forms, highs and lows are created.
【Basics of environmental recognition】
Environmental recognition is the analysis of the market’s power balance.
For that analysis,
Highs and lows = “the values settled by buying and selling forces” and “the starting point that forms the waveform”
must be clearly understood.
Proper environmental recognition is the first step to consistently earning profits.
After you finish reading this article, look at a chart with no indicators, just simple candlesticks.
Then check the highs and lows on that chart.
Imagine what drama unfolded around those highs and lows on that chart.
If you do, you should be able to see where you should trade.
As you start paying attention again to overlooked highs and lows, your trading level will improve significantly, so give it a try.
If you want to read other articles,
Eik FX Blogplease take a look.