

Achieve the scenario in half a day! Weekly GOLD Special Commentary Episode 2 Target Week: March 23, 2026 (Mon) ~
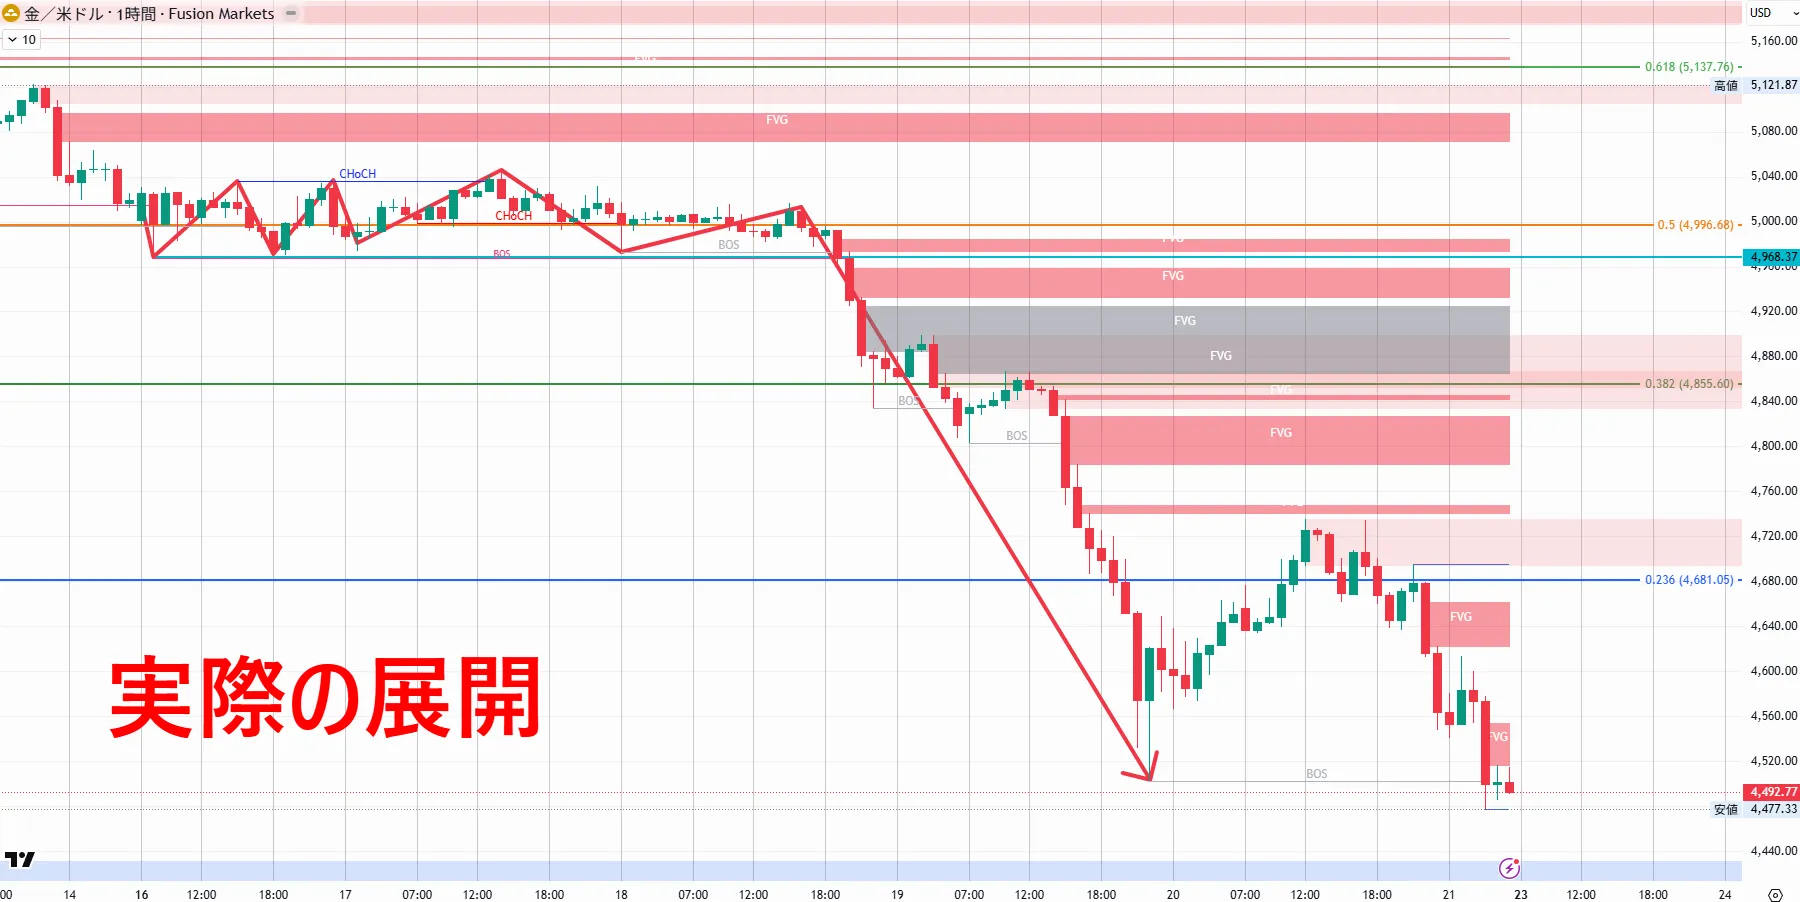
In the first installment, I wrote that “EQP (4,999.91) would be the main focus next week.” The result was that not only did EQP not break down, it even pushed beyond to TP2. From a high of 5,044 to a low of 4,477, there was a drop of about 5,670 pips (567 dollars). The closing price on Friday was around 4,492.
The direction of the scenario was correct. The zone was functional. The extension beyond TP2 was supported more by fundamentals than expected.TP2extended beyond, due to stronger-than-expected fundamental backing.
This time, I will review that background together with fundamentals and present next week's practical entry scenarios (3/23–3/28). The sequence is written as: Answer to last week → Fundamental breakdown → Next week's economic indicators → MTF structure → Scenario A to C.
■ Last week (3/16–3/21) review
In the first installment, Scenario A (EQP break → pullback) was considered the main path.
Result: Scenario A worked.A functioned.
I'll organize it chronologically.
Monday (3/16):As noted in the first installment, EQP (4,999.91) broke down. Judas Swing → sudden plunge to a new low of 4,967. 4H FVG zone (4,941–4,980) was reached. The first pattern of Scenario A, Entry ①, was triggered: “1H OB (4,960–4,988) × 4H FVG (4,941–4,980) rebound.”
Tuesday (3/17):
Wednesday (3/18):LH decline began from LH. A higher-high decline pattern led to a short entry at 5,009. Up to here, the scenario A followed.
Wednesday night–Thursday (3/18–19):PPI upsurge (+0.7%),→FOMC (dot plot shifted toward fewer rate cuts) caused a steep drop. TP1 (4,941 = lower end of the 4H FVG zone) → TP2 (4,856 = 4H fib 0.382) was broken, reaching a low of 4,477. TP2 extended about 3,800 pips ahead.
What exceeded expectations was the depth of the drop.TP1・TP2
■ Why GOLD plummeted — Detailed fundamental breakdown
“Gold rises in times of crisis as a safe asset.”—This is half-right and half-wrong.
This week, GOLD plunged while fighting escalations in the Middle East. Normally, it would be the opposite. I will break down the four causal links in order.
① PPI (Producer Price Index) upsurge →inflation reaccelerates
March 18 (Wed) release of the February PPI rose to +0.7% (est. +0.3%). At producer level, prices are rising sharply, which signals consumer prices (CPI) will be affected in a few months.
Impact on GOLD:
Chart reflection: PPI release caused an immediate drop, breaking below 5,000.
② FOMC(3/18–19) hawkish shift→loss of rate-cut expectations
3/18–19 FOMC maintained policy rate at 3.5–3.75%. This in itself was as expected. The surprise was the dot plot (Fed members’ rate outlook).
The median rate cuts for 2026 remained at 1 cut (same as last month),but the distribution shifted heavily toward fewer cuts, with 7 members at 1 cut and 7 at 0. Chairman Powell stated the median is the same, but there was a notable movement toward fewer rate cuts. The possibility of a June cut essentially vanished.
Impact on GOLD mechanism (why shrinking rate-cut expectations weighs on GOLD):
First, outline the relationship between interest rates and GOLD.
GOLD is an asset that yields no interest. US Treasuries, however, yield interest. If the Fed cuts rates, Treasury yields fall, reducing the relative cost of holding GOLD, which benefits GOLD. Conversely, a rate hike or higher rates makes GOLD less attractive.Thus:
In this FOMC, the expectation of one rate cut remained, but with more members shifting to 0 cuts, markets grew confident that rates would stay higher longer. The 10-year US treasury yield rose to around 4.37%, and GOLD saw fund outflows.
Additionally, real interest rates (nominal rate minus inflation expectations) rose. As real rates rise, the opportunity cost of holding GOLD increases, and institutions shift to yield-bearing assets, selling GOLD.
③ Hormuz Strait crisis→→→ GOLD negative
This is the most counterintuitive point.
From the end of February, US-Israel actions toward Iran effectively closed the Hormuz Strait. On 3/2, Iran attacked Qatar’s Ras Laffan LNG facility, damaging about 12.8 million tons of LNG production. Brent crude spiked near $110, up more than 50% from the end of February. This effect persisted into the FOMC week.
Usually, war leads gold to rise; however, this time the chain was: War → crude oil surge → inflation fears → Fed unable to cut rates → real rates rise → GOLD sell-off. The latter prevailed.
In short, war is itself bullish for GOLD, but if war itself worsens inflation, then via higher rates GOLD can be sold.
④ USD (DXY) rise
FOMC hawkish shift + PPI upsurge pushed the dollar index near 99.5.
Since GOLD is traded in dollars, a stronger dollar makes GOLD more expensive for foreign investors, reducing demand. The double hit of higher rates and a stronger dollar directly impacted GOLD.
⑤ Summary: chain of causation for this plunge
PPI upsurge
↓
inflation reacceleration signal
↓
FOMC: centerpiece remains 1 cut, hawkish shift though
↓
10-year yield up + DXY up
↓
Hormuz crisis → inflation concerns increase → rate cut expectations retreat further
↓
real rates rise + dollar strength
↓
GOLD plunge
4H FVG zone (4,941–4,980) functioned before PPI. On Monday, it rebounded to 4,967. By Tuesday, it retraced back to 5,044, forming LH. PPI + FOMC acted as triggers, breaking this zone. The 4H fib 0.382 (4,856) was breached, and the first swing low was 4,477. Between 4,856 and 4,401, there was a lack of notable support (a liquidity gap). The fundamental shock likely exceeded the TP targets, accelerating the move.
■ Next week (3/23–3/28) key economic indicators
Next week does not have a mega-event like the FOMC, but from Tuesday to Friday there are indicators that could move GOLD daily.
Tuesday3/24
① Flash PMI (manufacturing & services) ※Preliminary
Release time: 22:45
Leading indicator of the economy. Above 50 indicates expansion; below 50 indicates contraction.
→Manufacturing PMI exceeding expectations:“Healthy economy → Fed not rushing to cut → high interest rates”→ GOLD sell
→Manufacturing PMI misses expectations:“Economic slowdown → rate-cut expectations return”→ GOLD buy
→Services PMI weak if:US GDP 8% from services; deterioration here heightens recession fears, Gold buy (safe asset demand).
※2Month’s Manufacturing PMI: 51.6; Services PMI: 51.0. Hormuz crisis and tariff effects imply a downside risk for the preliminary March release.
②New home sales
Release: 23:00
Leading indicator of the housing market. High interest rates cooling housing data.
→“High rates pressure housing → rate-cut pressure”→ GOLD buy
→“Housing remains solid despite high rates → no need to cut”→ GOLD sell
Wednesday3/25
③Durable goods orders
Release: 21:30
Leading indicator of corporate capex. Core durable goods (ex aircraft) is key.
→“Companies are increasing investment → economy strong → no need to cut”→ GOLD sell
→“Companies cut investment → economy slows”→ GOLD buy
※2Durable goods orders for the month rose +3.1% month-over-month, but a temporary factor from large aircraft orders was large. Core was flat at +0.0%.
Thursday3/26
④Initial jobless claims
Release: 21:30
Weekly release of labor market snapshot.
→“Hiring worsens → economy slows → rate-cut pressure”→ GOLD buy
→“Hiring remains solid → no need to cut”→
※Recent figure: 223kk
Friday3/27
⑤
Release: 23:00
A sentiment indicator for consumers; pay attention to revisions from the preliminary release.
“consumers are pessimistic → spending slows → recession fears”→ GOLD buy
→“consumers are optimistic → spending is solid”→ GOLD sell
Importantly, the 'expected inflation rate' item.Michigan 1-year ahead inflation expectations rising provides fuel for the hawkish stance of the Fed and is negative for GOLD.
■ Next week's overall fundamental view
This is after the FOMC, so there are no mega events. However PMI (Tuesday) and University of Michigan Confidence (Friday) can change market sentiment.
• headwinds for GOLD: hawkish Fed (1 cut), DXY rising (near 99.5), 10-year yield rising (4.37%), crude oil high → inflationary long-term concerns
• tailwinds for GOLD (potential): recession signals (NFP -92,000, GDP +0.7%), tariff-related uncertainty (301 pages in scope), central banks buying gold (over 750,000 tons per year pace), and waning confidence in the dollar.
If PMI next week is weak, a recession narrative could emerge and GOLD could become a buying catalyst. Conversely, strong PMI would reinforce the idea of higher-for-longer rates, presenting further headwinds for GOLD.The Tuesday PMI is the most influential for next week’s direction.
Daily: uptrend structure continues formally — but approaching deep pullback levels. The big picture remains an uptrend (CHoCH confirmation requires a daily close below HL near 4,270). Daily Fibonacci levels (Low 4,401 ↔ High 5,598.32) 0.236 at 4,681; 0 at 4,401 (coincides with 4H swing low). Deepest part of daily discount zone: near 4,470–4,745 (OB premium to the immediate 1H FVG upper).
4-hour: continued down structure — 4H swing low at 4,401 nearby.
1-hour: continued down structure — FVG clusters form a ceiling
1H FVG forms from three levels: bottom around BOS, middle near 0.236 fib, top above OB. The middle FVG overlaps with 4H FVG, making it highly notable.
1H OB sits between middle FVG and upper FVG; it overlaps with 4H OB.
1H Fibonacci major levels (Low 4,477 ↔ High 5,236):
・ 0.236 = 4,655.70 (breached this week)
・ 0 = 4,401 ( aligns with 4H swing low)
M15: BOS chain — bullish CHoCH after BOS then bearish CHoCH resumes.
M15 shows bullish CHoCH around 4,725 before resuming bearish CHoCH around 4,650; recent action remains Bearish BOS.
■ Next week (3/23–3/28) practical entry scenarios
Premise:4H・1H・M154,401 is a zone where the 4H swing low and daily fib 0 align, the major decision point for both structural and fib aspects. However, at daily level, it sits at a deep pullback level, so prepare for a reversal scenario as well.
This time I’ve narrowed the scenarios. There are certainly down opportunities outside the zones as last week, but narrowing helps clarity.
【 ScenarioA: Monday retracement sell → test 4,401 (main)
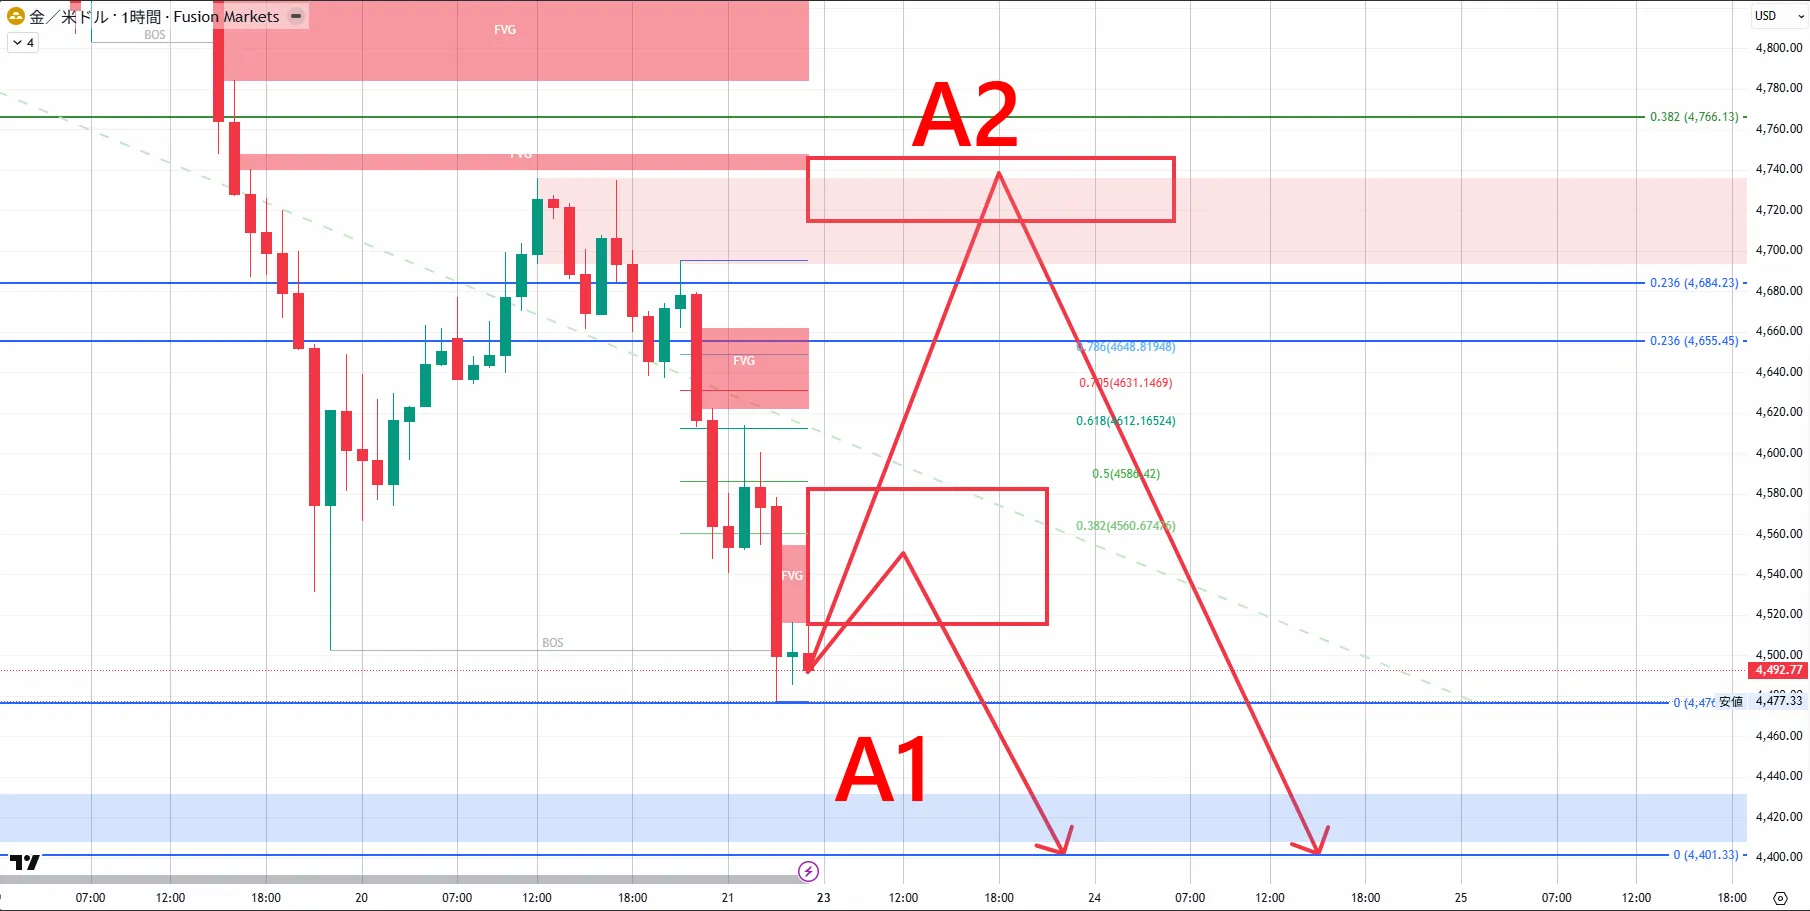
Since down structure remains on all timeframes, Monday will target shorts depending on retracement depth.
A1
From around 4,492 at Friday close, a small rebound may occur at week start. A cluster of M15 FVG remaining from Friday’s decline could act as a lid.
① M15 FVG cluster reached
② M15→M5 down pattern confirmed → short
SL:Near the most recent high of entry or where the down pattern is negated
TP1:
TP2:4,401(4H swing low)
break above 4,580 in price action→ switch to A2
Momentum of Friday’s rebound continuing into Monday. A bearish OB (4,693–4,734) that formed on Friday’s rebound becomes the main retrace sell.
SL:
TP1:
TP2:4,401(4H swing low)
break above 4,745 in price action → OB and FVG negated, switch to B
【ScenarioB: Deep retrace revert to retrace sell (0.5–0.705)
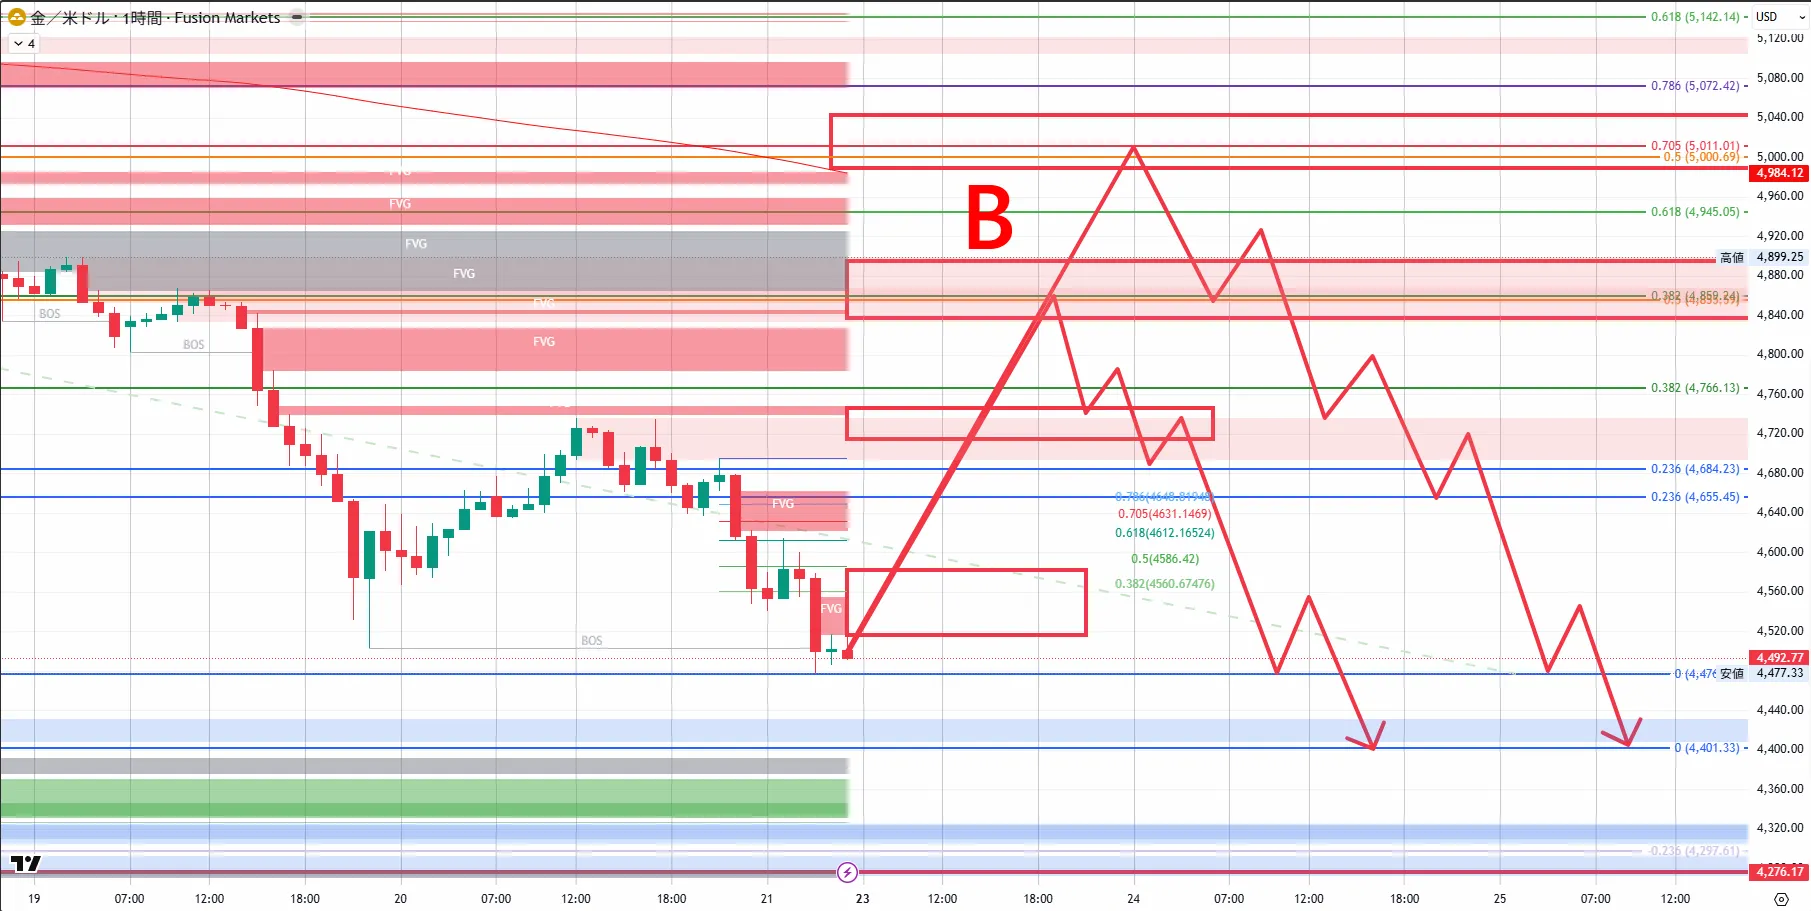
Premise: PMI weak → rate-cut expectations resume or other fundamental factors deepen retraceA
SL:
TP:
Invalidation: break above 4,705 (5,012) in price action → exit sell scenario.
【ScenarioC: Branch after reaching 4,401 (most important decision point)
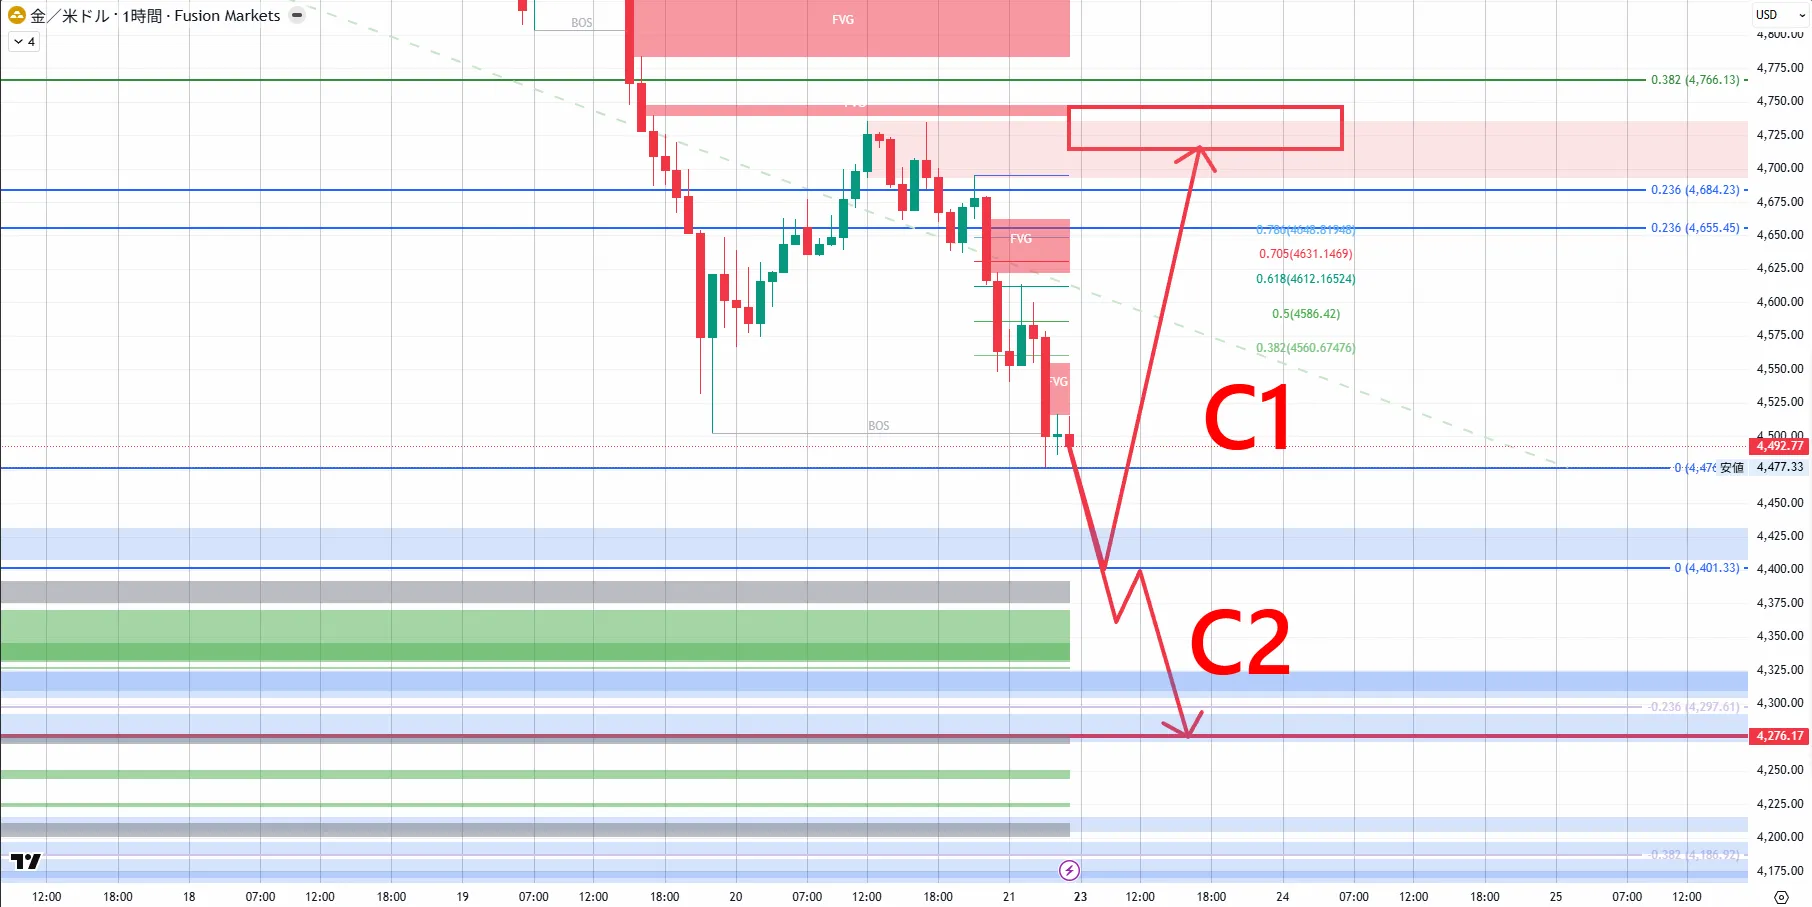
The premise: 4,401— movement here will determine the next development of the 4H structure.
C-1
Premise: 4,401 briefly dips below, then returns with a 1H–4H wick. A pattern that trims daily liquidity and reverses higher. Could form a reverse head-and-shoulders shape.
:
Premise: 4,401 is decisively broken to the downside with a real body.
【Turning points】
4,401 break in price action → C-2. Daily uptrend structure risk of collapse.
0.705 (5,012) break above in price action → exit sell scenario.
【Practical entry notes】
If OB range is wide (e.g., 300 pips or more), draw a 50% line inside OB. If short, enter above the 50% line (premium side) to narrow SL and enter from a favorable position.
Reaching a zone alone is not enough. If there is a strong reaction that forms FVG on M1–M5, the justification is stronger. If no FVG appears, be cautious. If a 50% retrace of FVG occurs, entering may limit losses.
At uncertain turning points such as around 4,401, avoid forced entries. If direction is not confirmed, wait for CHoCH or BOS confirmation for safety.
A1 → A2, in that order. If a decline starts Monday morning, target A1 testing last week low (4,477) with SSL sweep → test 4,401. If a retrace occurs, wait at OB zone (4,715–4,745). If retrace deepens after Tuesday, wait for B’s 0.5 → 0.705 steps. When 4,401 is reached, decide between C-1/C-2. Confirm whether a wick returns or a real break to decide next action.
4,401 reached → decide C-1/C-2. If a wick returns, or a real break, then move accordingly.
Honestly, last week was shocking. PPI → FOMC hit hard, layered with Hormuz crisis-driven oil inflation. Yet, technically, it held. The 4H FVG zone produced a proper rebound on Monday, LH formed near the 4,967, and retracement sell followed Scenario A. The direction and the zone were correct. The unexpected part was the depth that extended TP2 beyond expectations, driven by fundamentals.
My basic plan for next week is “A2 (bearish OB zone 4,715–4,745 for retracement sells) as primary, test 4,401, and prepare for a pullback scenario.” Given the current structure and momentum, expect to test lower. Confirm triggers (CHoCH, pin-bars, FVG formation) before shorting. Also watch for Judas Swing in the London KZ for directional patterns.
However, 4,401 is also the Fibonacci starting point on the daily chart, so a wick-based reversal is entirely possible. In such cases, avoid forcing entries; wait for direction confirmation. It’s safer to ride CHoCH after it appears.
Next week tends to feature wider price ranges, so keep lot sizes down. OB1 with ample pips exists in places where even 300 pips swing is possible. Even with small lots, large pips yield profits.
━━━━━━━━━━━━━━━━━━━━━━━━━━
■ About the continuation of this analysis (Part 3 onward)
This weekly GOLD analysis is distributed every weekend.
Part 3 (target week: 3/30–4/3) will cover:\n- Answer to Scenario A and C from Part 2\n- Next week's practical entry scenarios\n- Fundamental breakdown\n- Detailed MTf structure
—— scheduled release.
■ About the SMC course (Investment Navi+)
From Part 0 (What FX is and What SMC is) to Part 8 (Practical Scenario Creation), all are publicly available. The terms and concepts used in this weekly analysis are all explained in the course.
▶ SMC course (Investment Navi+) Serial issue is here
https://www.gogojungle.co.jp/finance/navi/articles/111684?via=navi_search
■ About the tundere series
Nao-style semi-discretionary pyramiding EA. When the trader decides direction and places a market order, the EA automatically manages limit orders, small profit taking, trailing stop, and protecting profitable positions. A division of labor: “direction by the trader, management by the EA.”
This weekly analysis is written to train decisions on where, why, and how to enter within the tundere series. Understanding the boundary between what the EA handles and what you decide yourself is key to maximizing this EA’s power.
▶ Purchaser perks
・SMC analysis video, TradingView SMC composite indicator
・Online community access
・Weekly GOLD special analysis (distributed every weekend)
・SMC foundations course
・Lifetime free version upgrades
▶ Details on tundere【R】 here
https://www.gogojungle.co.jp/tools/indicators/71019?via=toppage_recentViewed
━━━━━━━━━━━━━━━━━━━━━━━━━━