
Episode 8: Before Trading, Decide—5 Steps to Create a Scenario [SMC Practice Part ②]
Hello,naodesu.
In the last issue (Episode 7), I gave you a framework that integrates top-down analysis and kill zones. The flow is: decide direction on higher timeframes, identify entry zones on mid timeframes, and enter on triggers from lower timeframes that enter the kill zone.
This time, I will hand you the actual steps to use.actual steps to use
——This article is to help you move beyond that stage. The theme is simple.「Before trading, verbalize the scenario and draw it on the chart」.That’s all.
■Why create a scenario in advance
Making judgments while the chart is moving is more difficult than you might think.
When price suddenly breaks to a new high, you feel rushed: “Is this a breakout? Should I ride it?” and you end up jumping in. Or, price enters a zone but you hesitate, wondering “Will it really reverse?” and the candle closes before you have a chance to enter.
These patterns of “think after the move” happen when emotions distort judgment.
The solution is simple:“Decide the scenario in advance.”.
“If Asia makes a high above theBSLM15——This is decided before the chart moves. Then, when the market moves, what you do is only to verify whether it aligns with the scenario. It’s not a judgment; it’s a confirmation. With confirmation, you can allocate your judgment to coping with unexpected moves.before the chart moves
Reducing the space for emotion, you can evaluate yourself by whether you made a decision based on solid grounds. This is the biggest merit of scenario creation.
There is one more important thing.Scenarios can fail, and you should accept that from the start. “Failure” does not mean you did something wrong; it means the market moved differently from your scenario while you followed it correctly. Trading without a scenario is far less reproducible than trading that followed a scenario.
■When to create it——“Create it before your trading session.”
The timing for creating a scenario is simple.Before your trading session, open the chart and first create (or confirm) the scenario. Make this a habit.For day trading (main)
: If you’ll look at the chart from morning, create the scenario in the morning. If you’re joining from the London KZ, aim to create it before London KZ (14:30–15:00 JST). Even if you created it in the morning, update it before the London KZ with Asia-time movements. It’s a one-day scenario: if this zone behaves like this in London KZ, enter accordingly.If your main focus is NY time, create it before NY KZ (19:30–20:00 JST). You can incorporate both Asia and London moves. The more information, the higher the accuracy of the scenario.
Scalping: Generally the same process as day trading, butM15M5OBFVG
Swing trades: Not updated daily. Once weekly or daily candidate zones are identified, build a scenario and monitor with the overarching idea of “price enters this zone, then a turn signal on 4H and 1H to enter.” It can take days or weeks to reach a zone. When reached, go down to lower timeframes and time the entry.
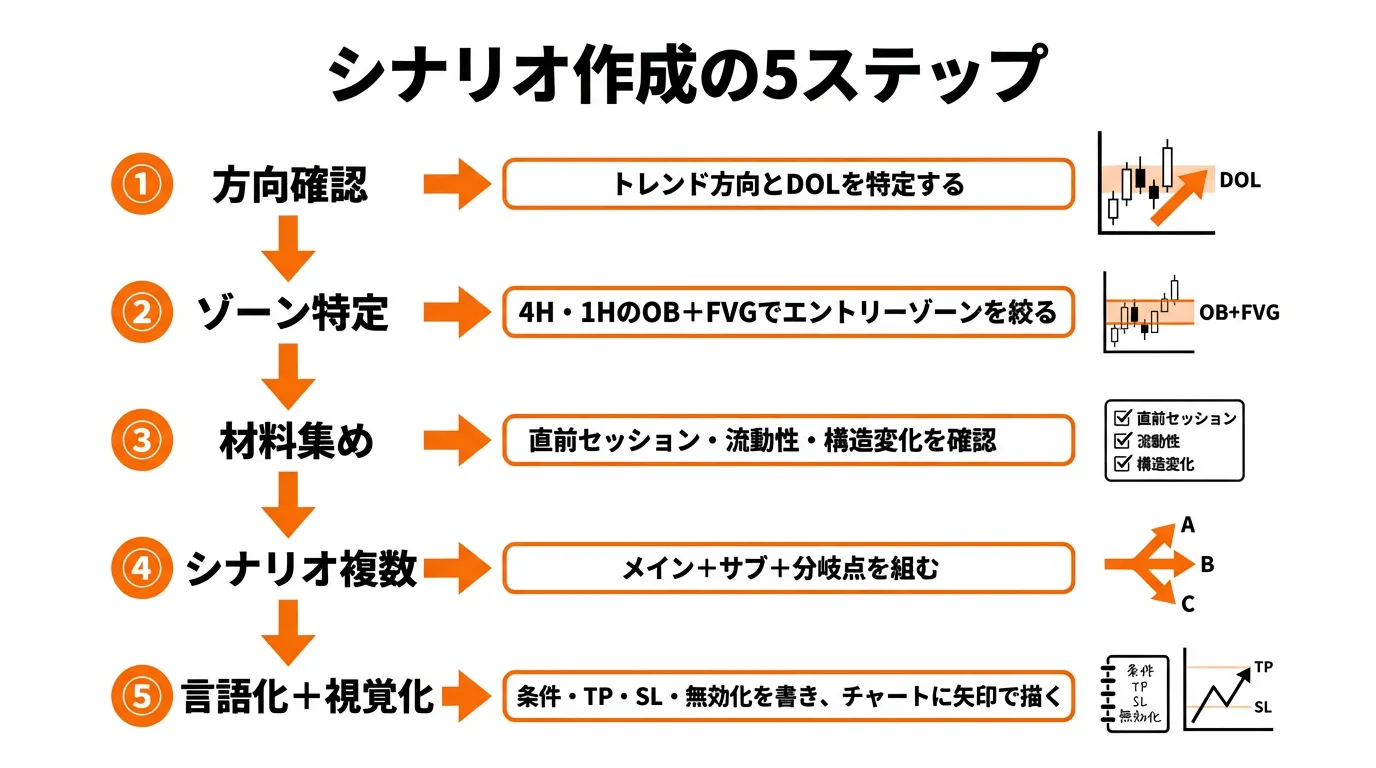
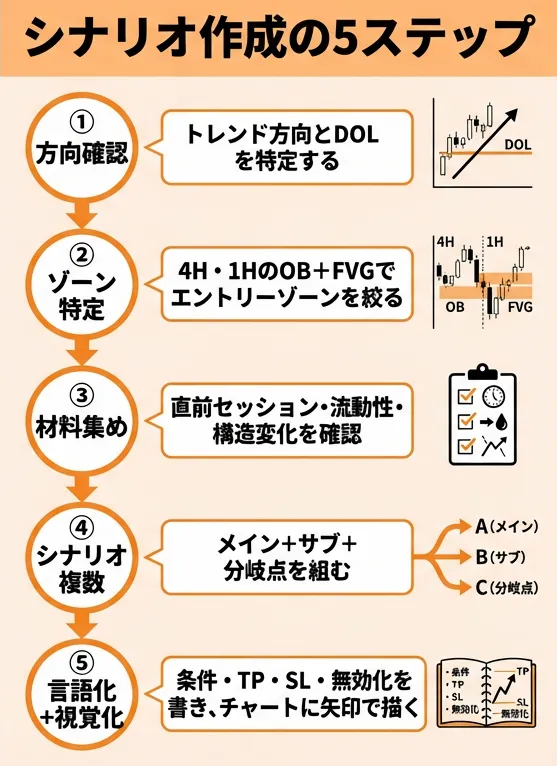
■5-step scenario creation (day trading)
Episode 7’s framework is落 to the scenario creation procedure. By performing these7
Steps①Confirm direction (identify DOL)
First, look at the higher timeframe and confirm which direction the market is heading. You should check two points: the current trend direction and the DOL (Draw On Liquidity = where price is likely drawn next).
▼Confirm trend direction
Look at weekly, daily, and 4H to see BOS/CHoCH in the most recent sequences, and decide whether the trend is to continue HL/HH (up) or LH/LL (down).
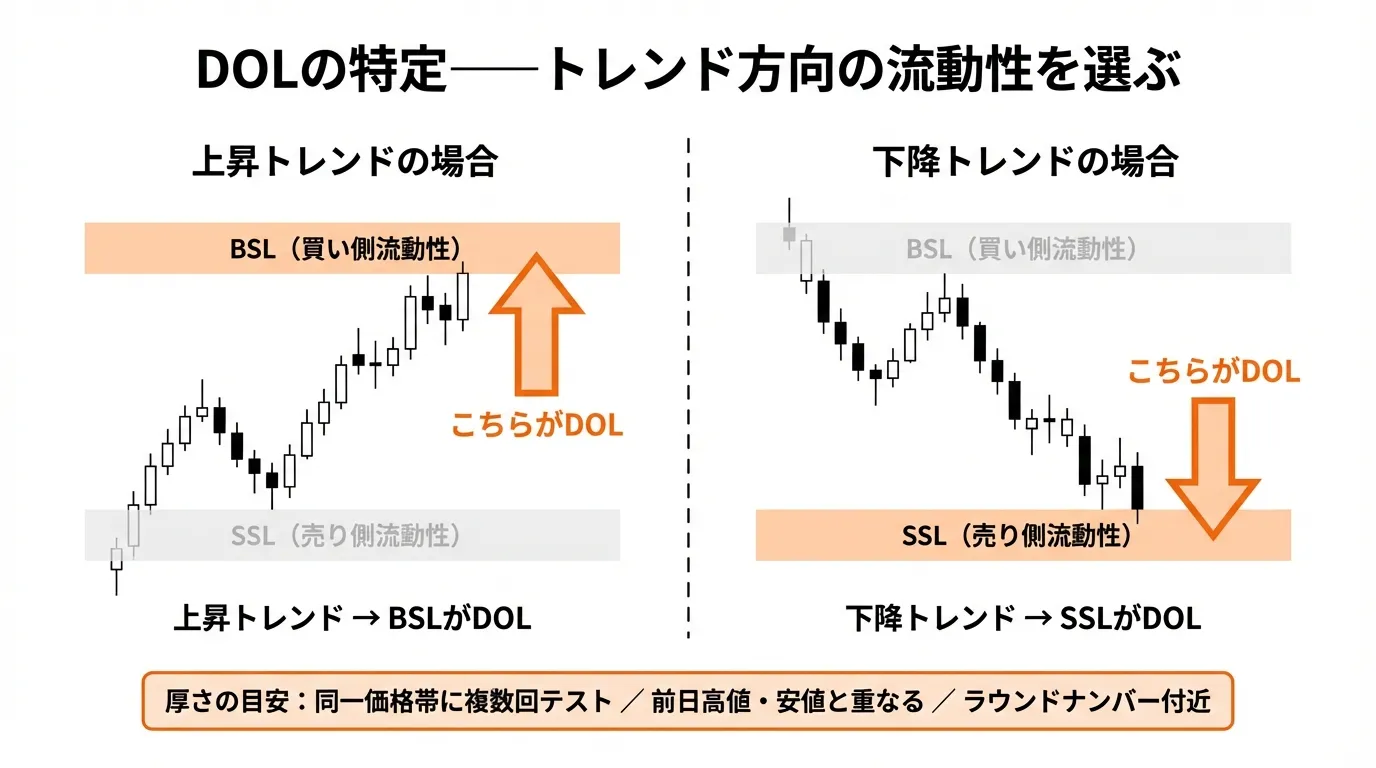
▼ DOL identification
Liquidity sits above highs and below lows. Above highs is theBSLSSLBSLSSL
▼ DOL thickness
If there are multiple DOL candidates, the level with thicker liquidity exerts stronger pull. A good rule of thumb is the number of overlaps: repeated highs/lows in the same price zone (for example, around 5,040 there are 3 highs), nearby recent highs/lows, round numbers near the zone, etc. The more these factors align, the more likely there are stacked SLs and stop orders behind them. Conversely, a high that only occurred once may indicate thinner liquidity and lower reliability as a DOL.
▼ When timeframes disagree
Sometimes different timeframes point in different directions.
For example, the weekly/daily may show an uptrend, but the 4H shows a down structure. If the daily HL hasn’t been broken yet, the 4H down move is a pullback within the daily uptrend. Day traders can follow the 4H direction (sell) and treat SSL as DOL, but you should use the daily HL vicinity as the guideline for how far to push. Going beyond that risks getting swept into the daily uptrend. If the daily HL is broken, the daily chart turns into CHoCH and both daily and 4H align on a down structure, expanding the DOL down to the daily level SSL.
Another scenario: daily and 4H are up, but 1H is down. Here, 1H is a shorter-term pullback. For scalping, you can set SSL to the 1H direction (sell), but for day trading it’s more natural to wait for the 4H pullback zone to buy.1H
This confirmation determines today’s orientation (buy or sell) and price targets.
Step② 4H1H
Next, move down to the mid timeframe to refine the entry zone.
To summarize: Step ① “direction, DOL”; Step ② “entry zone”; Step ⑤ “entry trigger” are based on different timeframes.
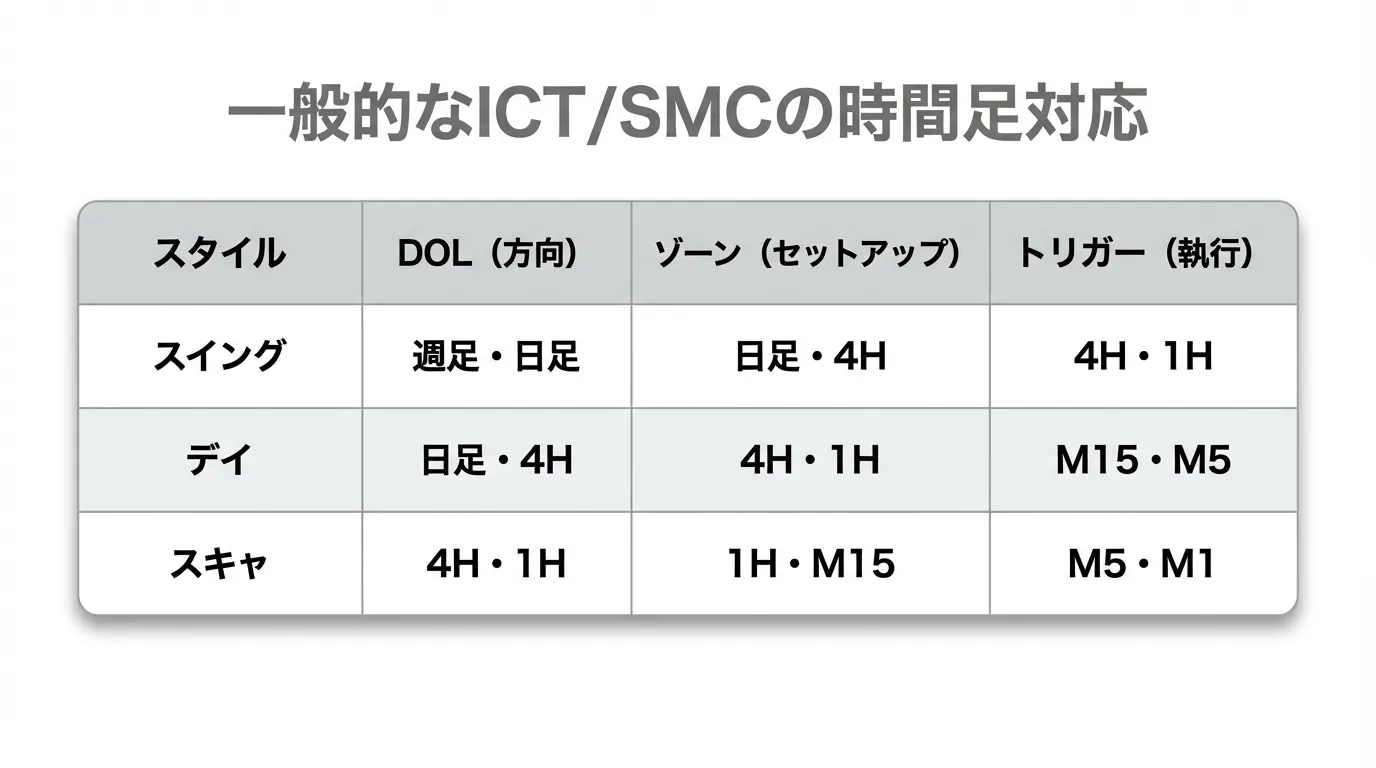
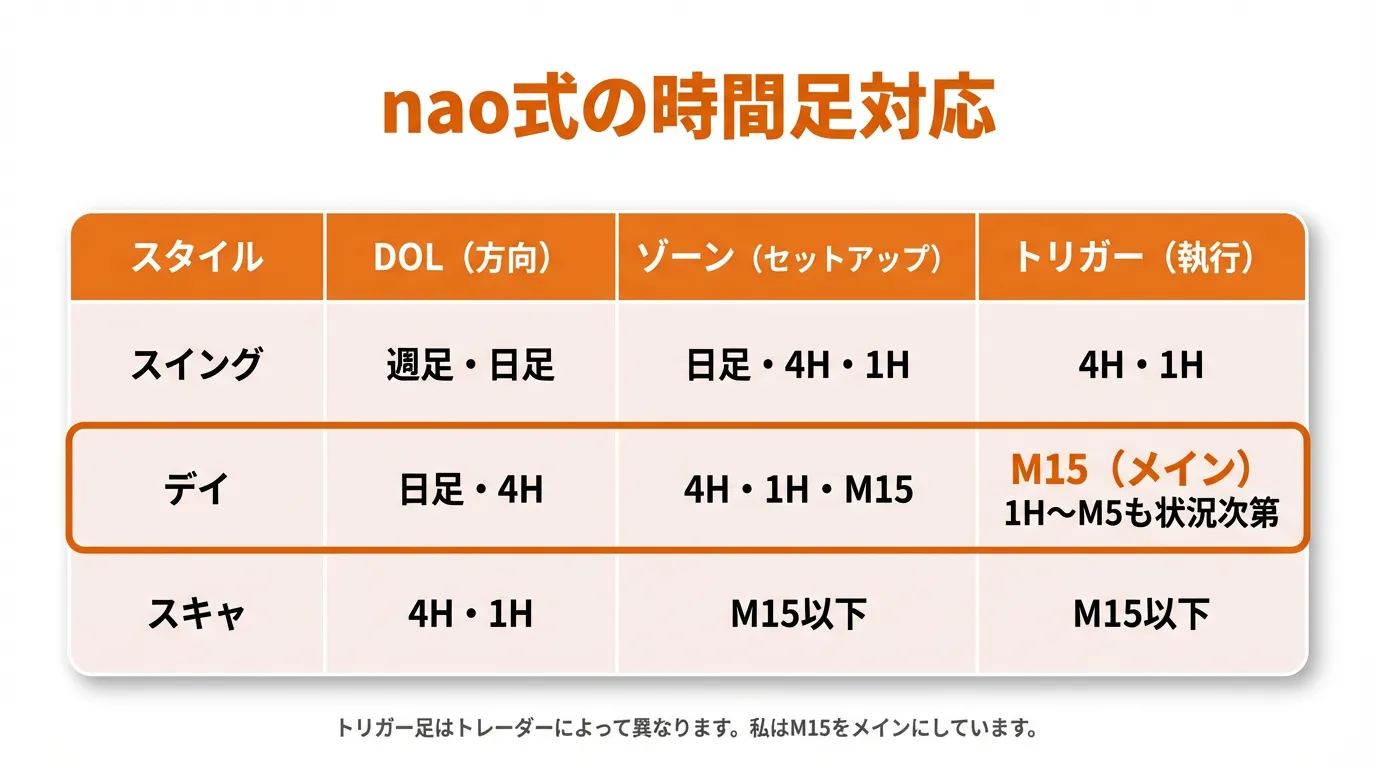
DOL sets the big direction and target; the lower timeframe narrows the entry zone; the even lower timeframe provides the trigger. The difference lies in the width of the zone and trigger, and I tend to view the zone a bit wider. Trigger timeframes vary by trader. A price action on 1H (like a pin bar) can be the trigger, or after an M15 CHoCH, using M5 FVG to refine entry. I mainly use M15. In this article I’ll use day trading (DOL = daily and 4H; zone = 4H, 4H/M15, trigger = M15 main), for explanation.
For a selling bias, look for bearish OB above the zone (EQP > 0.5) and bearish OB below the zone for a buying bias. If FVG overlaps OB, the reliability increases. If OTE Fibonacci zone overlaps (0.705–0.786), it’s a higher-precision zone.
This step determines today’s price range to target.
Step③Gather materials for the scenario
Steps ①② have set the direction and zone. Next gather materials to build the scenario. All concepts explained up to Episode 7 come together here.
: Asia high/low, London moves. The immediate flow becomes the starting point for the next session.
: around the prior session’s range highs near the BSL, and near the lows near SSL.
: Before starting trades, check the lower timeframes for BOS and CHoCH.
OB+FVG: whether the zone identified in Step ② is untested or tested.
: On days with big indicators like FOMC, CPI, jobs data, revisit the scenario.
There are more materials: unfilled FVGs, premium/discount positions, prior day/week highs/lows, distance to entry zones, etc. This topic is deep enough to fill a full article, but initially focusing on these five items is enough. They don’t all have to be present. Use the collected materials to build the scenario in the next step.
Step④——
With the materials ready, create several “if this happens, then I will enter like this” scenarios. It’s practical to have more than one scenario, including a main and a sub.
For example, before London KZ, if you’re bearish and there is a BSL accumulating above the Asia high, the following scenarios could be possible.
ScenarioA(Judas Swing target): Use the Asia high BSL that you confirmed in Step ① as the basis, sweep it at London KZ start (a temporary upward spike) and then reverse and drop. Enter short after the sweep is confirmed.
ScenarioB(direct drop): Use the lower-timeframe structure change (bearish BOS in M15) confirmed in Step ③, start dropping without a sweep. Enter short on a pullback from BOS with the return formed by OB+FVG.
ScenarioC(split point exceeded → mindset shift): If price breaks above a level indicating structure will change, drop the sell scenario and switch to a higher bias. Split-point examples: the swing high on 4H, CHoCH starting point, or a high that was swept and passed through.
A・Bdoes not hit the scenario’s target zone, so gather materials and build a new scenario. If all fail, don’t enter; wait for the next kill zone. The important thing is to decide in advance what to do when the scenario fails.
Step⑤Confirm exact values and draw on the chart
Finally, fill in precise numbers into the previously built scenarios.①④
For each scenario, articulate the following four points.
: “When price reaches the ○○ zone and the trigger I expect appears (for example: bearish CHoCH on M5, pin bar, return from BOS), I enter short.”
(take-profit lines): “TP1 is △△, TP2 is □□, TP3 (if any) is ◇◇.” The target is the DOL identified in Step ①. If there are FVG or OB along the way, they become partial take-profit points. For example, “TP1 = EQP (4,997), TP2 = SSL in front of the DOL (4,975), TP3 = SSL (4,967)” and so on.
SLSL (stop-loss lines) (stop loss): “Exceed the upper edge of the entry zone by a certain number of PIPS.”: “Exceed the upper edge of the entry zone by ○○ PIPS.”
: “Before entry, if price breaks the actual body of ○○, the scenario is invalidated (or reverse entry considered). After entry, SL acts as a limiter, so invalidation conditions are the pre-entry criteria.”: “If the entry criteria are not met, and price breaks above the upper edge of the zone in real body terms, invalidate or switch to the opposite side.” After entry, SL is active, so invalidation conditions refer to pre-entry criteria.
Create scenarios A, B, C for each. It’s not necessary to write everything perfectly at the start; notes are fine. Start with the main scenario (1) and, as you get comfortable, add sub-scenarios and branches. It’s okay to start small. In total, it can take about 10–15 minutes.Make Scenarios A, B, C for each. It’s not necessary to write everything in prose; notes are fine. Start with the main scenario (1) and, as you gain confidence, add sub and branching scenarios. It’s fine to start with a relaxed pace; a total of about 10–15 minutes is enough at first.
Recommendation: write them on a note and stick it on the side of your PC screen. “Direction: short,” “Zone: ○○ to ○○,” “If trigger does not appear, skip.” Even this much reduces hesitation when you face the chart. Add reminders like “exit on FVG breakout” to prevent emotional judgments. I started this way too. Now arrows on the chart suffice to keep it in mind, but early on I needed sticky notes.A good practice is to write them as notes on your PC monitor. “Direction: short; Zone: ○○ to ○○; Trigger: if not present, skip.” This alone reduces chart-facing hesitation. Also, paste reminders like “exit on FVG breakout” to prevent emotion-driven decisions. I started this way too. Now I can rely on arrows drawn on the chart, but in the beginning sticky notes helped me avoid wandering.
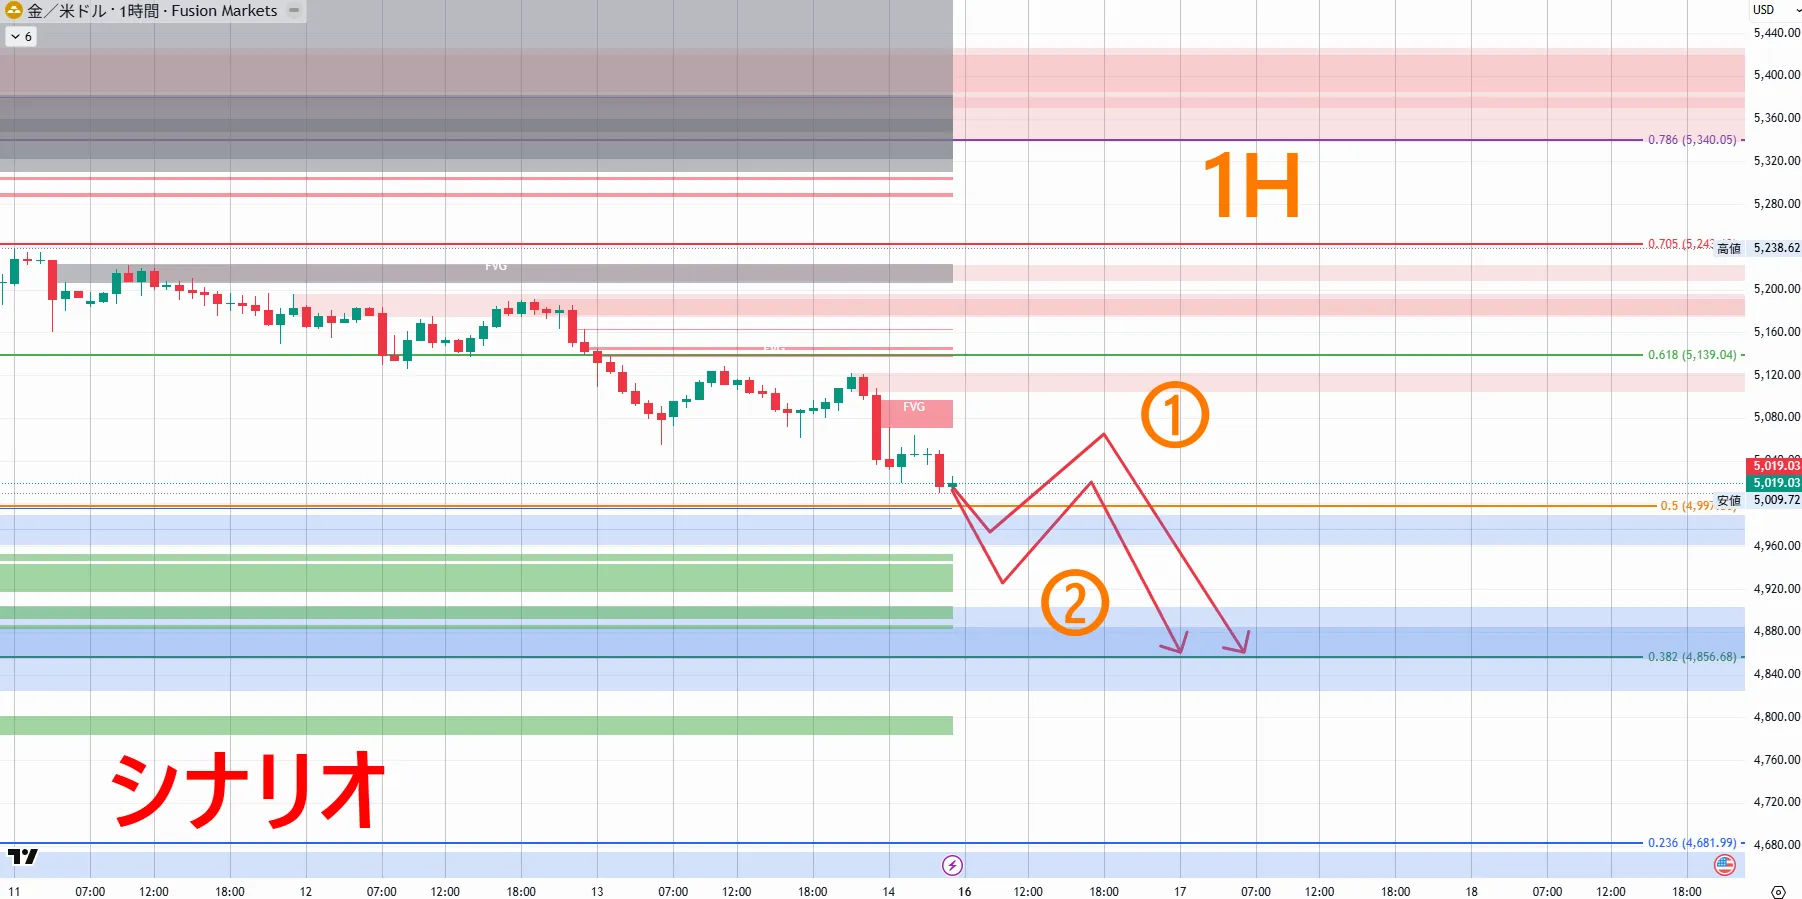
After you language-encode the scenario, draw arrows on the chart. Visualize the flow: “rise to here → turn here → fall to here.” The angles of the arrows reflect where OBs or FVGs exist or will form, and they can also be TP candidates. I always draw several scenarios as arrows on TradingView. When you only have words, scenarios can be abstract; on a chart, you can clearly see “which price band” and “what flow will move how.”Once you’ve language-encoded your scenario, draw arrows on the chart to visualize. The flow, from rising to turning to falling, becomes clear. The angles of arrows reflect existing OBs or FVGs or potential OBs+FVGs that could form and serve as TP candidates. I typically draw multiple scenarios with arrows on TradingView. Words alone can be abstract; on the chart, you can clearly see “which price band and how the movement will unfold.”
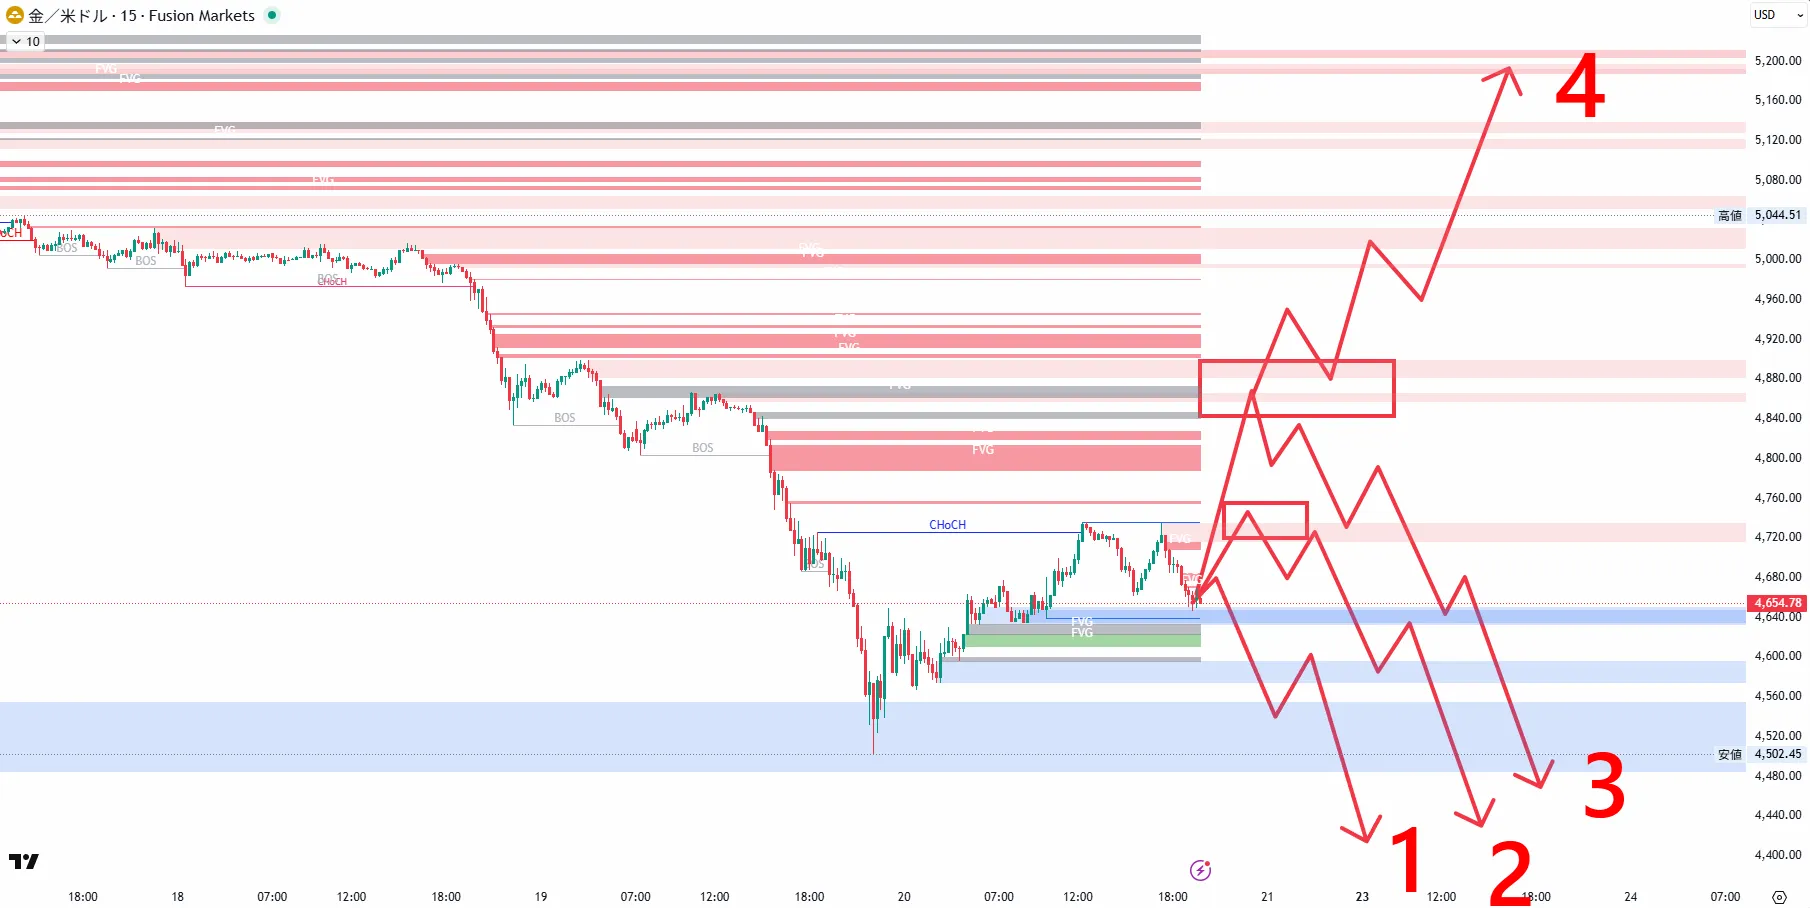
Red boxes mark zones I judge as important.Red boxes mark zones judged important.①①A pullback after the initial dropA pullback after the initial fall②②A drop from the recent resistance bandA fall from the immediate resistance band③③A drop from the higher resistance bandA fall from the higher resistance band④④
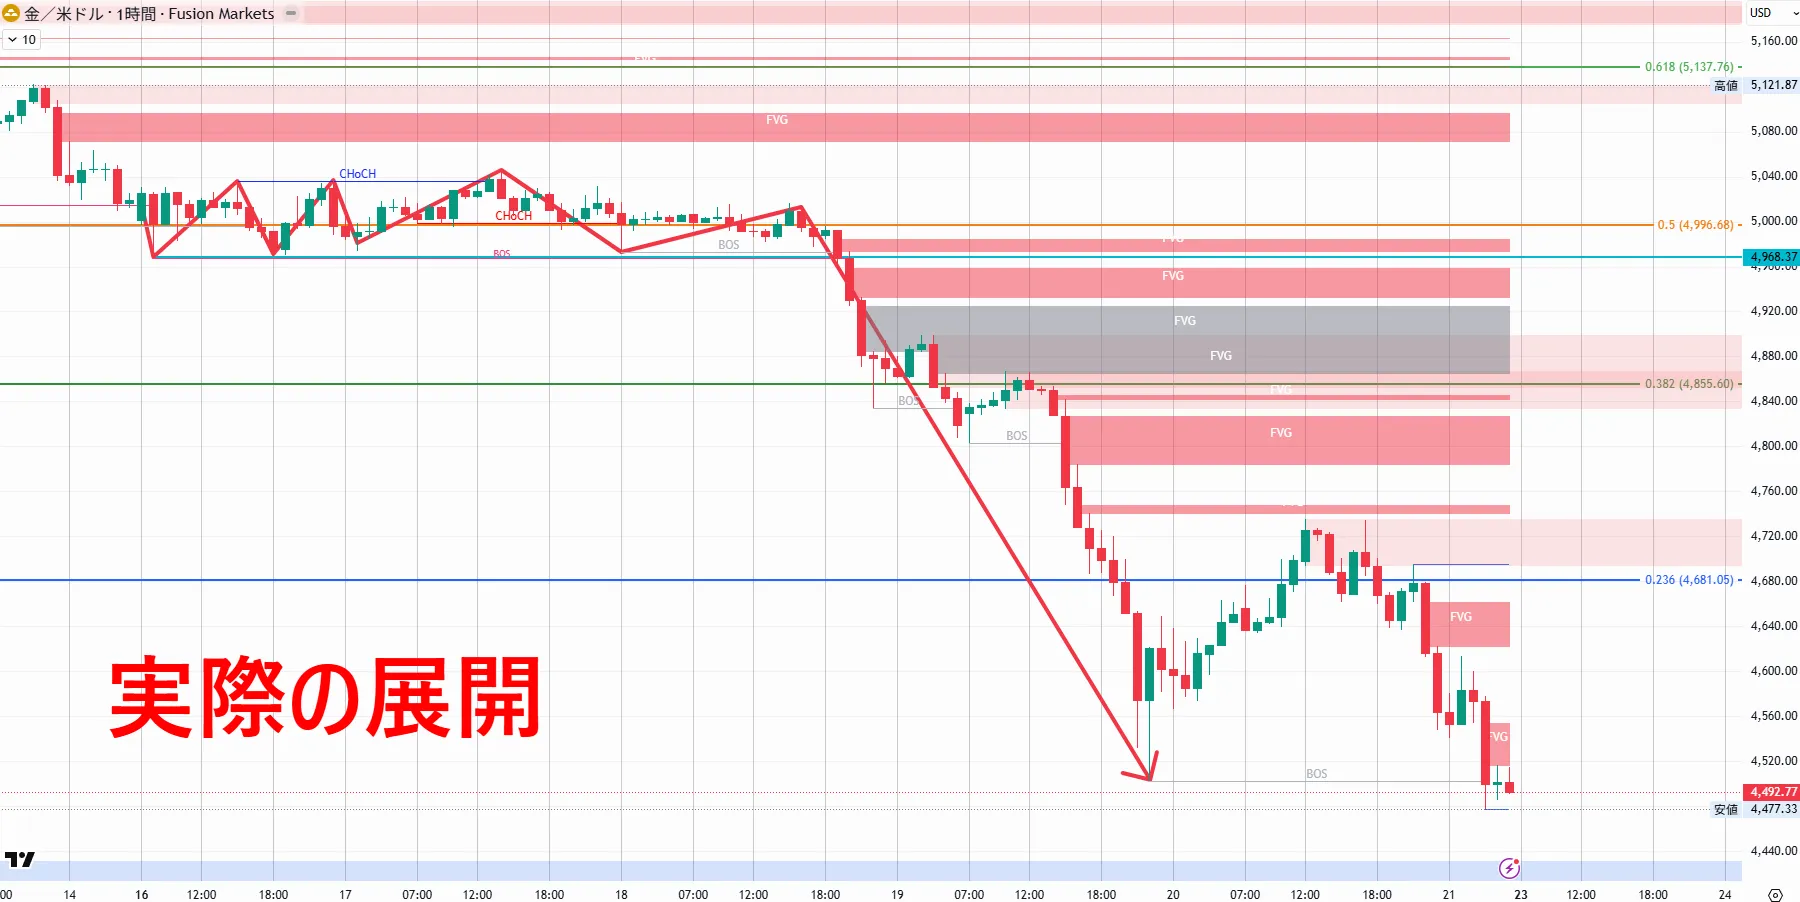
■■Example: Next Week Scenario Created on SaturdayCase study: Next week's scenario created on Saturday——GOLD 3/16——GOLD 3/163/20
To answer the question “how do I actually use the 5 steps?”, on March 14, 2026 (Saturday), I will recreate the process of building next week’s GOLD scenario. This excerpt comes from the weekly GOLD special commentary, Episode 1 (3/15 distribution) of the ongoing tundere series.To answer the question “how do I actually use the six steps?”, I will reproduce my process of building next week’s GOLD scenario on Saturday, March 14, 2026. This excerpt is from the weekly GOLD special commentary Episode 1 (3/15 release) of the ongoing tundere series.

Even day traders should check the higher timeframes for next week’s direction and zones on weekends. When you open charts on weekdays, you’ll move faster if you already have a rough framework.Even day traders should check the higher-timeframe directions and zones for next week on weekends. When you open charts on weekdays, you’ll make judgments faster if the broad framework is already formed.
【Saturday (3/14)】【Saturday (3/14)】55
①①Direction andDOL confirmationDirection andDOL confirmationDOLDOL
Friday close was 5,019. The weekly/daily trend remains up (daily HL around 4,270 is still intact). However, the 4H chart showed the high on 1/29/2026 at 5,598.32 had turned into a CHoCH; the swing low near 5,419 formed a down structure. The 4H swing low (4,401) BOS remains unconfirmed, but the recent highs are making the bearish bias dominant. The 1H structure is also down.Friday’s close was 5,019. Weekly/daily charts show an overall uptrend (daily HL around 4,270 remains protected). However, 4H showed the high of 5,598.32 on 1/29/2026 and CHoCH confirmed, followed by a lower high (5,419) forming a down structure. The 4H swing low (4,401) BOS remains unconfirmed, but the recent highs are stepping down, so selling bias is dominant. The 1H is also down.
“The daily trend is up, but the 4H and 1H are down, so the mindset is to sell.” DOL is SSL on the lower side. Specifically, the 2/17 low (daily Fibonacci 0.382 ≈ 4,856) suggests liquidity below, so price may be drawn there. The 4H FVG zone (4,941–4,980) is a TP candidate.“Daily trend up, but 4H and 1H down, so the direction is to sell.” DOL is SSL on the lower side. Specifically, the low from 2/17 (daily Fibonacci 0.382 ≈ 4,856) suggests liquidity below, so price is drawn there. The 4H FVG zone (4,941–4,980) is a TP candidate.
②②Entry zone identificationEntry zone identification
1H1HM15M154H FVG: In the 4H FVG zone, the overlap with 1H and M15 forms a confluence where entries are supported. If price breaks and rebounds stop there, it becomes a candidate for short entry zones.
③③Gathering materialsMaterial gathering
• 4H and 1H both showing downtrend.M15
④Create multiple scenarios
ScenarioA(EQP break → return rally → main bias): Break EQP in price with a real body, rebound within the 4H FVG zone’s 1H OB (4,960–4,975), then return to the entry zone (4H FVG area around 5,063–5,071) to short after waiting for a lower-timeframe trigger. TP1: 4,941 (lower end of 4H FVG), TP2: 4,856 (daily Fibonacci 0.382), TP3 (if any) near 4,960 (4H FVG zone).
B(EQP rebound → sell zone from above): EQP briefly rebounds and price falls to the entry zone around 5,063–5,071 or higher to 5,120–5,137 for a pullback sell. TP1: 5,019 (recent low), TP2: 4,999 (EQP), TP3: 4,960 (around 4H FVG zone).
Scenario(branch beyond threshold → mindset shift)
⑤Numbering and drawing the chart
Finally, insert precise numbers into the Step ④ scenarios and draw them on the chart. From Step ① through Step ④, translate what you’ve considered into when/where/how price will move.