

Vol. 7 “Where” and “When” Align to Allow Entry — Integration of Top-Down Analysis and Kill Zone 【SMC Practice ①】
Hello, this is nao.
From the 1st to the 6th, we have stacked one weapon of SMC onto another. Market structure, BOS/CHoCH, liquidity, order blocks, FVG, premium discount +0.705 — they have all come together, haven’t they?
This time, I will hand you a map for how to combine and use those weapons.
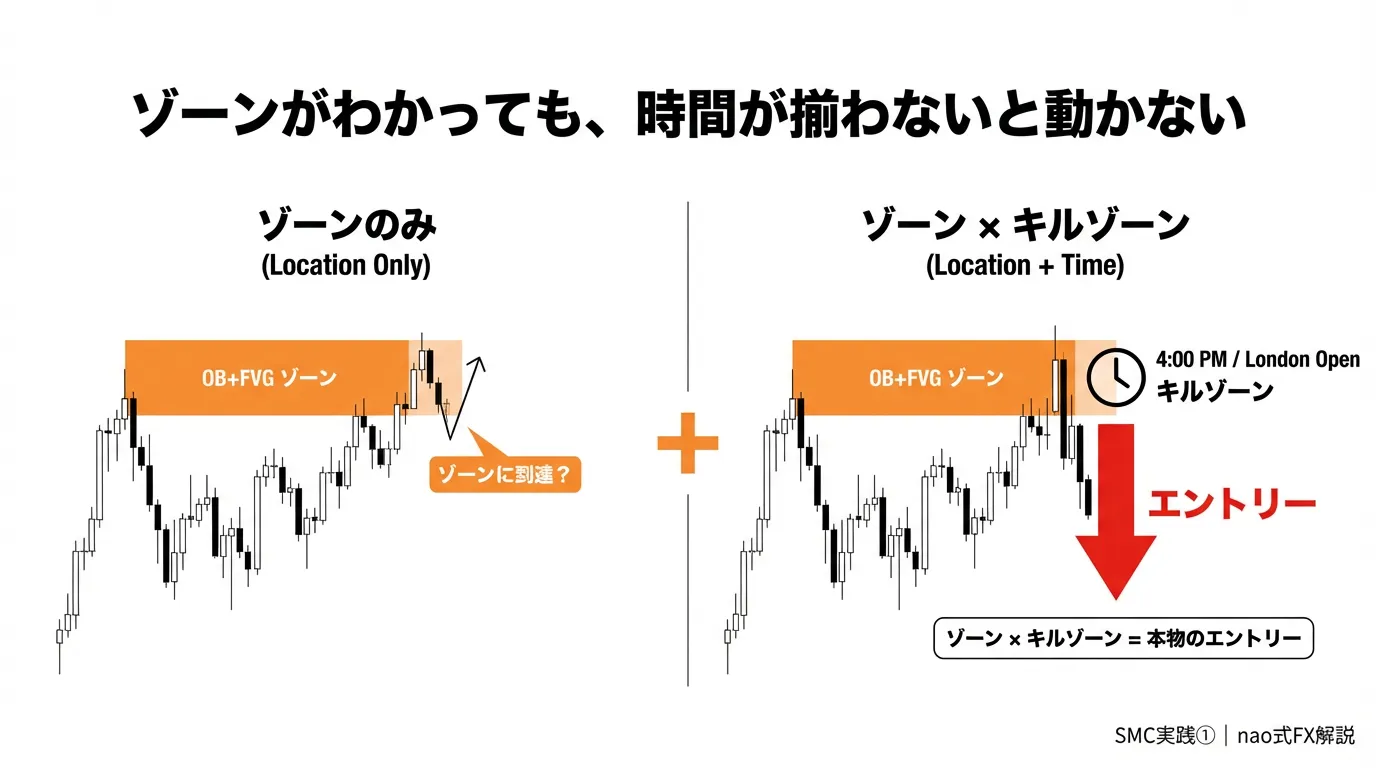
However, I must be honest about one thing here.Merely learning “where to enter” isn’t enough.Only when “when to enter” is added does the logic become complete.
The method to maximize the weapons learned from the 1st to the 6th — the integration of top-down analysis and the kill zone.
■ Main terms used in this article
The following abbreviations appear frequently in this article. If you are seeing them for the first time, it will be smooth to check them first.
・SL (Stop Loss): A stop-loss order. An order that automatically closes a position when it reaches a certain loss.
・BSL (Buyside Liquidity): The aggregation near highs of “short SL (buyback orders)” and “breakout buy orders.” When price reaches here, those buy orders are executed simultaneously.
・SSL (Sellside Liquidity): The aggregation near lows of “long SL (sell to close orders)” and “breakout sell orders.” When price reaches here, those sell orders are executed simultaneously.
・DOL (Draw on Liquidity): A price level where liquidity is pulled to next. The market’s “next destination.”
・BOS (Break of Structure): Structural destruction by piercing recent lows/highs with a real body. A sign of trend continuation.
・CHoCH (Change of Character): A sign that the prevailing direction collapses and reverses.
■ Top-down analysis: stacking weapons from higher timeframes
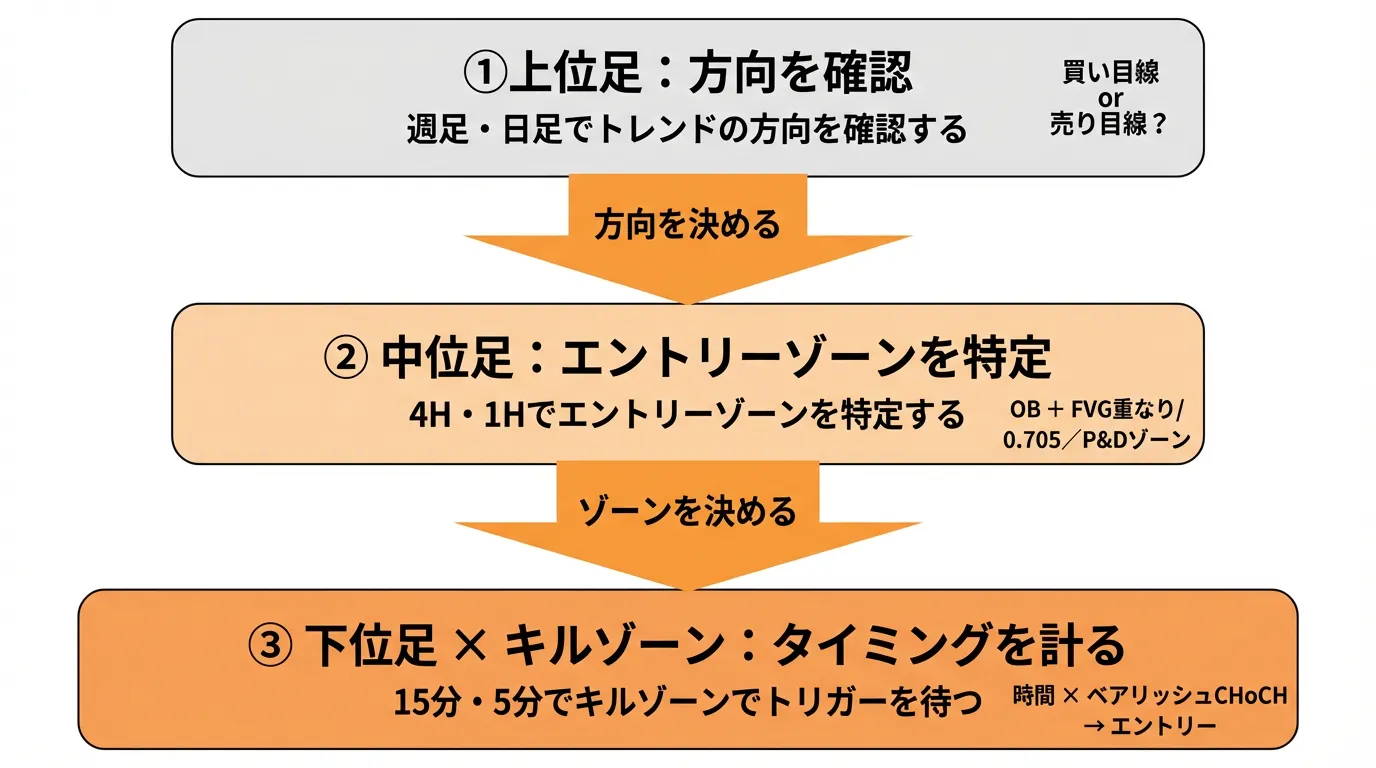
Top-down analysis isthe process of analyzing from higher timeframes to lower timeframes in order.
It is a three-step flow: confirm the direction on higher timeframes (weekly, daily), identify entry zones on mid timeframes (4H, 1H), and gauge entry timing on lower timeframes (15m, 5m).
Why look from the top? The reason is simple:the trend on higher timeframes reflects the true intent of big players. If you only look at the 1-hour chart and think “upward pattern,” and then the daily trend is downward, you would be simply trading a rebound in a retracement.
Follow the flow of higher timeframes, accumulate entry grounds on lower timeframes.That is the essence.
So far, this has been about “direction and location.” The next part is about “time.”
■ Kill Zone — When time is added, the market changes
Even if you can identify the zone, you may have experienced moves that pass through the zone or start moving somewhere else without reaching it. The main cause isthat your entry timing is misaligned with the hours when institutions are actively moving.
ICT’s concept of the “Kill Zone” refers to the specific times when institutions are actively placing orders. The FX market operates 24 hours, but the times when significant moves occur and the zone is effective are only a few overlapping sessions for several hours.
Main Kill Zones (in Japan time)
・Asia Kill Zone(Summer 9:00–13:00 JST / Winter 10:00–14:00)
Tokyo-centered session. It used to be relatively quiet, but in recent years GOLD has shown more activity. With massive inflows from Chinese retail investors, continued gold purchases by the People’s Bank of China, and the Shanghai Gold Exchange’s活性化, moves rival those of London and NY at times. Judas Swing patterns are characteristic of London, but Asia time also has its own liquidity dynamics that can’t be ignored. There are times when Sydney’s pre-Tokyo light turnover leads the move. Liquidity is thin, so many moves are sweeps rather than real breaks, and price often retraces into Tokyo time. Knowing this helps avoid panicking into entries during sharp moves before Tokyo time.
・London Kill Zone(Summer 15:00–18:00 JST / Winter 16:00–19:00)
The most important time of the day. London traders participate and often sweep the range highs/lows built during Asia before moving in the original direction.
・New York Kill Zone(Summer 20:00–23:00 JST / Winter 21:00–24:00 JST)
The second major move with the arrival of NY traders. It can extend or accelerate the London flow, or sometimes negate London’s move before continuing in the main direction. This is a particularly important time for GOLD.
■ Asia Arrange → Sweep → Actual Direction — The three-act structure of the market
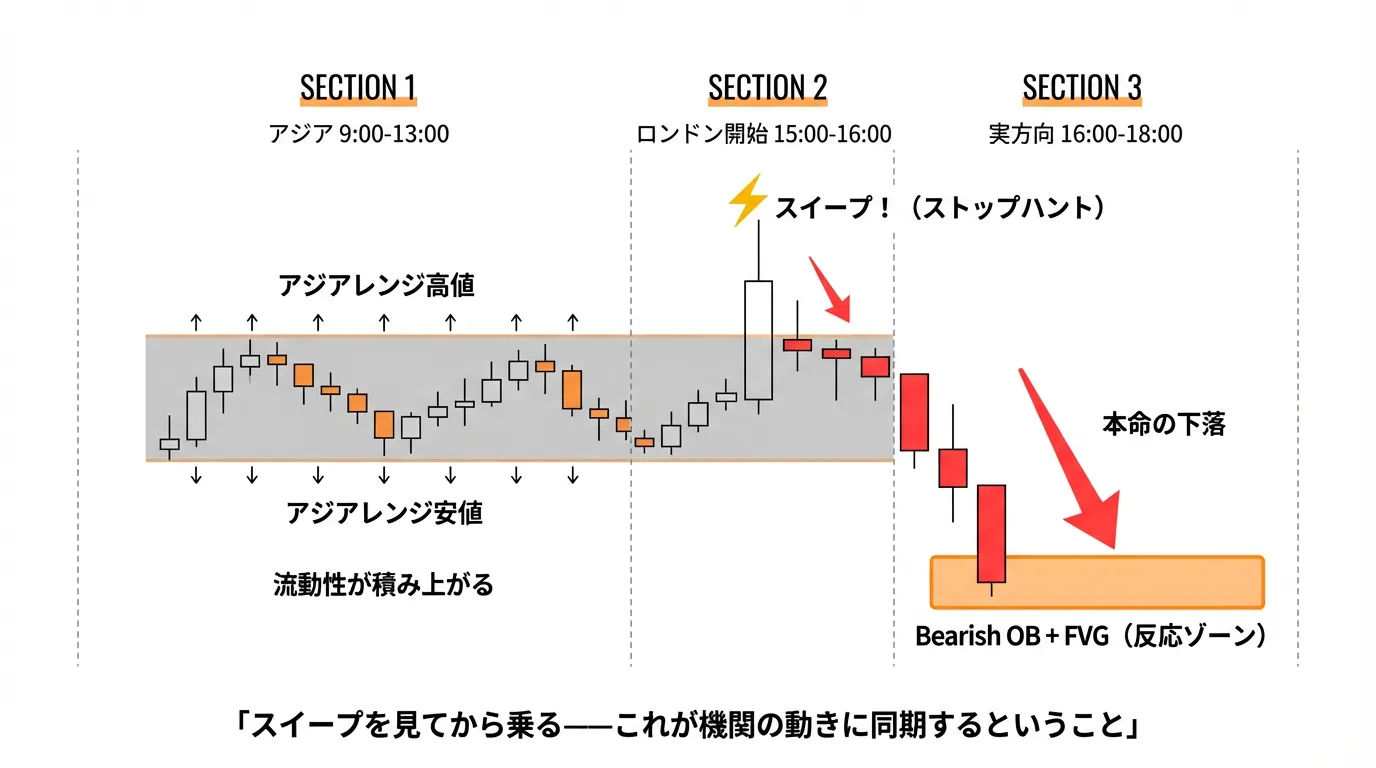
Understanding kill zones reveals that a day’s price action forms a “three-act structure.”
Act 1: Asia (10:00–15:00 JST) — Range formation (Accumulation)
The big players are not moving aggressively yet. Small ranges accumulate, and retail traders’ stops cluster around the highs and lows. The “liquidity pool” described in the 3rd installment is formed here.
Act 2: London start (Summer 15:00–16:00 / Winter 16:00–17:00 JST) — Sweep (Manipulation)
What London traders often do first is briefly “sweep” the Asia range highs or lows. This is the stop hunt in the 3rd installment. They target retail positions that leapt in during the breakout and begin building the real big positions using that liquidity.
Act 3: Actual direction movement (Summer 16:00–18:00 / Winter 17:00–19:00 JST) — Distribution
After the sweep ends, price moves in the actual direction. OBs learned in the 4th installment and FVG from the 5th installment respond as reaction zones.
+ NY (Summer 20:00–23:00 / Winter 21:00–24:00 JST) — 2nd Round
The London move is often pushed further by NY traders. There are cases where price moves toward targets within SSL or BSL below/above London’s target. Be aware of the pattern where the London move is negated and then re-accelerates (a reverse sweep).
■ Judas Swing and Draw on Liquidity — The mechanism institutions set as a “trap blueprint”
The second act of the above three-act structure, the movement that briefly sweeps Asia range highs or lows right after London starts — this has a name.Judas Swing.
“Judas” comes from Judas, who betrayed Christ. It looks like price will rise, then suddenly drops. The move lures buyers who followed the breakout and then traps them—this is exactly what the name implies.
So why must institutions sweep in the opposite direction first—this is whereDraw on Liquidity (DOL) comes in.
DOL is the place where price is drawn to the next liquidity. The price is constantly attracted to something. That “something” is the liquidity pool — the cluster of buy and sell orders (and their stops) around the Asia range highs and lows.
Importantly, the direction of DOL tends to be opposite to the actual direction.
What matters is thatthe direction of DOL is determined by the higher timeframe trend. When the 4H and daily charts are bearish, the DOL price target is not the lower edge of the current range, but a much larger liquidity pool lower down (SSL). However, price does not head there in a straight line—it first sweeps the higher-layer BSL to collect liquidity, then moves toward the eventual target of SSL.
Judas Swing itself is a temporary sweep. Institutions build BSL with that rise, then reverse after taking profits. Once BSL is cleared, DOL shifts to the lower SSL, and price declines. If the 4H/daily are bullish, the lower sweep toward SSL then DOL will shift to the upper BSL and move upward.
So how to read this on actual charts? Firstconfirm the direction (DOL orientation) on higher timeframes, then keep in mind that liquidity zones on the opposite side (BSL/SSL) may be targeted. When price approaches that zone and a quick move away with a wick appears, suspect a sweep. If confirmed, the next DOL is the liquidity pool on the higher-timeframe trend.
Note that this pattern works best whena solid range forms during Asian time. The more the range forms, the more liquidity accumulates at the highs and lows, increasing the material for sweeps. Furthermore, if FVG or OB overlaps near the recent high/low of that range, it becomes a zone where institutions are more likely to reverse.
Don’t just say “I broke above, so buy.” First identify the important zone, observe its movements closely. If price breaks and then retraces with a wick, suspect a sweep.“A rise sweep is more a signal of the next decline.”—This reversed interpretation is essential to ride institutions’ moves.
■ March 16, 2026 Real-world example — From BSL Sweep to decline
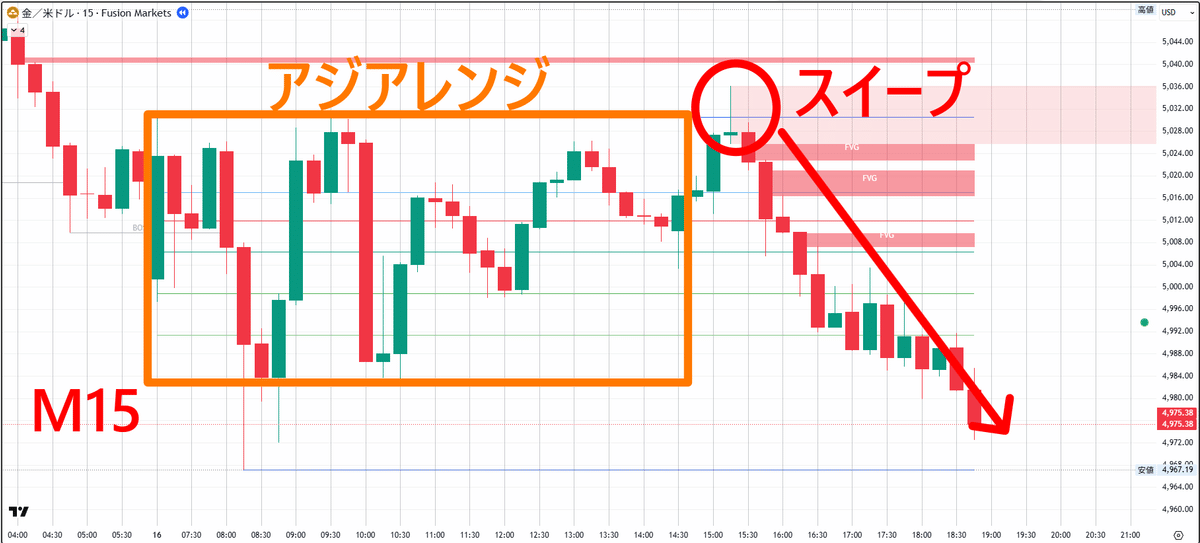
In GOLD on this day, a case where the first part of the three-act structure was confirmed is shown.
Assumption: 4H, 1H, and M15 show a downfall structure
As a precondition for entry, this day had a Bearish BOS (break of structure) confirmed at 07:00 on M15. Moreover, the higher timeframes showed 4H CHoCH confirmed and bearish structure, and 1H also confirmed CHoCH/BOS with a bearish bias. In other words,all three timeframes 4H, 1H, and M15 were bear-biased. The trades always follow the order: decide direction on the higher timeframe, then wait for triggers on the lower timeframe.
Asia time (until around 14:00 JST): accumulation
Price formed an Asia range around 5,009–5,031. Above this range high (around 5,031), there were accumulatedBSL (buyside liquidity)composed of breakout buy orders and short-sell stops.
London KZ (around 15:15 JST): briefly pushes above the high and reverses
Around 15:15, price broke above the range high to around 5,036 and quickly reversed. This is the sweep that wipes out buyers who jumped on the breakout and collects short stops. In real-time, one suspects a sweep when you observe the move breaking the high and retracing with a wick.
Entry trigger: CHoCH on M5
If this high-touch can be identified as a sweep, use the bearish CHoCH on M1 or M5 (recent price action breaking the low and signaling a reversal) as the entry trigger. The flow is: confirm direction on higher-timeframes (4H, 1H, M15) → suspect sweep at high touch → time the entry with M5/M1 CHoCH.
Actual direction (until ~19:00 JST): gradual decline
Subsequently, price declines step by step, piercing EQP around 4,997 and reaching 4,970.
Honest assessment of this case
The high touch (5,036) followed by decline was observable. However, it cannot be said to have “completed” Judas Swing, as SSL (the immediate prior low 4,967.19) was not reached and price turned at 4,970. It was close, but Judas Swing appears in some situations—sometimes fully realized, other times stopping a few PIPs short of SSL. The important thing is toset SSL as the DOL (target) when building the trade. Knowing the definition of Judas Swing’s completion allows accurate evaluation of both fully realized and near-miss cases, improving future analysis accuracy.
■ Practice: Integrating the four elements with GOLD
Using GOLD as an example, I will integrate all elements into a single flow.
Step 1: Determine direction (weekly and daily)
As of March 2026, GOLD maintains a strong uptrend on weekly and daily charts (as long as the recent daily HL around 4,270 holds, the uptrend structure remains intact). However, on the 4H the all-time high around 5,598 has CHoCH confirmed, and a bearish structure persists.
Under these conditions, the judgment isthe daily timeframe is up overall, but the view below 4H is biased toward selling on rallies.
Step 2: Identify entry zone (4H, 1H)
Move down to mid timeframes and use all weapons from Installments 4–6 to narrow the entry zone.
In my view, zone identification guidelines are: for swing trades, daily and 4H; for day trading, 4H and 1H; for scalping, 1H and M15. If you are bearish, look for bearish OB in the premium zone (EQP > 0.5). If you are bullish, look for bullish OB in the discount zone (EQP < 0.5). If an OB overlaps with FVG, confidence increases (as discussed in Installment 5: “OB + FVG overlapping zones = the highest precision area”). Furthermore, if Fibonacci 0.705–0.786 (OTE zone) overlaps, that zone is even more precise.These are additive: more overlap equals stronger basis for entry. It does not mean you cannot enter unless all conditions are met. OB alone can justify entry if it aligns with the Kill Zone and lower-timeframe CHoCH.
Step 3: Wait for the Kill Zone
Once the zone is identified, wait for time. The main battlegrounds are London (Summer 15:00–18:00 / Winter 16:00–19:00 JST) and NY (Summer 20:00–23:00 / Winter 21:00–24:00 JST). Asia KZ offers entry opportunities as well, but reaction there is often slower than London or NY.
Step 4: Confirm a trigger on the lower timeframe
When inside the Kill Zone, monitor the lower timeframes. In my view, entry triggers are best on 4H and 1H for swing, 1H and M15 for day trading, and M15 and M5 for scalping. You would typically go two steps down from the zone’s timeframe.
Before price reaches the OB/FVG zones, CHoCH, BOS, or sweep-like moves may appear. There are three main valid entry signals.Bearish CHoCH(the recent ascent breaks and updates a new low, a reversal signal),BOSReversal candles in the OB zone(pin bars, engulfing patterns, etc.). Any one, or several, overlapping signals provide a good entry timing base.
“Entering when inside a zone does not automatically mean you should enter.”Zone × Kill Zone timing × Lower-timeframe entry signals—— The more these three coincide, the stronger the case for entering.
■ nao's Real Talk: What changed after focusing on Kill Zones
Before focusing on Kill Zones, once you entered a position you mostly waited passively. If the price moved poorly, you didn’t cut it, thinking “it will move eventually,” and you could end up stagnating near the end of the Kill Zone and still holding, sometimes ending at breakeven. This happened many times.
After focusing on Kill Zones, what changed waslearning how the “end of time” looks. If movement is sluggish near the Kill Zone’s end, you close once. Look at how price moves at the Kill Zone entry, then decide. This alone significantly improved win rate and PIPs gained per trade.
Finding zones and reading time are separate skills. And importantly,for Japanese traders, both London (Summer 15–18:00 / Winter 16–19:00) and NY (Summer 20:00–late night / Winter 21:00–late night) are realistically accessible times. Evening after work is a real advantage.
■ Summary: Today's three key points
①Use top-down analysis to decide direction → zone → trigger in that order.Check trend on weekly and daily, narrow entry zone using OB + FVG overlap + 0.705 + premium zone on 4H and 1H, and wait for CHoCH on the lower timeframes. Use all weapons from Installments 4–6 here.
②Kill Zone determines “when to enter.”London (Summer 15:00–18:00 / Winter 16:00–19:00 JST) and NY (Summer 20:00–23:00 / Winter 21:00–24:00 JST) are the main battlegrounds. Asia KZ offers entries too, but London and NY take priority.
③The sweep is Judas Swing — look for the opposite move.The reverse move that occurs right after the London KZ starts is called Judas Swing. It sweeps BSL above, prompting institutions to accumulate shorts, then DOL shifts to SSL for the actual move downward. However, Judas Swing is only considered complete when, after the sweep, price breaks the SSL’s body to the downside. Do not enter on the sweep alone; wait for confirmation via BOS and CHoCH.
Next timeScenario-building practice— this time, I will explain, step by step, how to build a trading scenario the day before and on the day of trading using this framework.
─────────────────────────
【Author Profile】
─────────────────────────
nao | 16 years as a full-time FX trader, EA developer
Specializing in GOLD scalping and day trading based on SMC/ICT.
As I traded, I encountered the issue of “correct reading but mental bias causing a setback,”
and developed a hybrid tool “tundere【R】” for discretionary entry × EA automation management.
Providing a system that eliminates the fear of losses and maximizes profits during favorable moves for GOLD traders.
▶ Details about tundere【R】 here
https://www.gogojungle.co.jp/tools/indicators/71019?via=toppage_recentViewed