2026/3/7 Dollar/Yen, Gold, SP500, Nikkei 225 environment

The indicator in the attached image uses the indicators above.
Break Edge 9 is recommended. It is continually evolving.
For verification purposes, we have prepared weekly videos showing the USD/JPY price moves.
USD/JPY
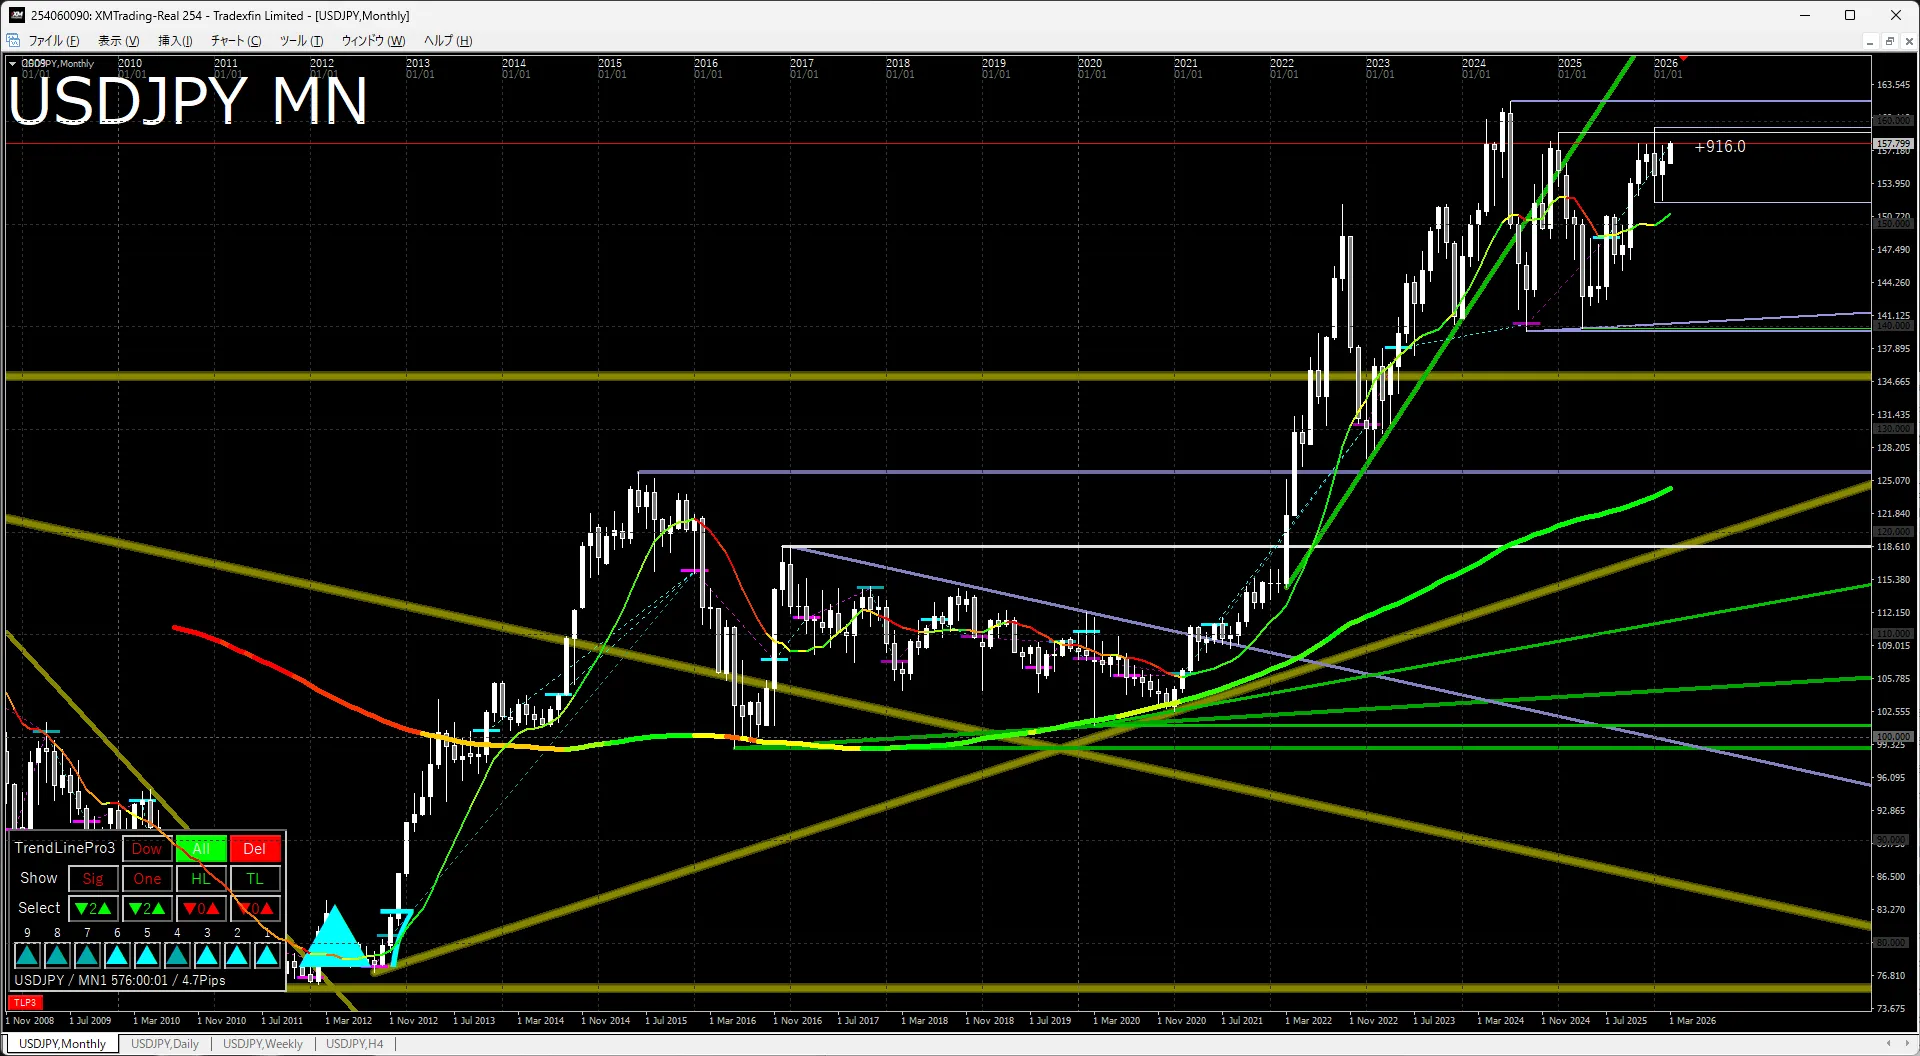
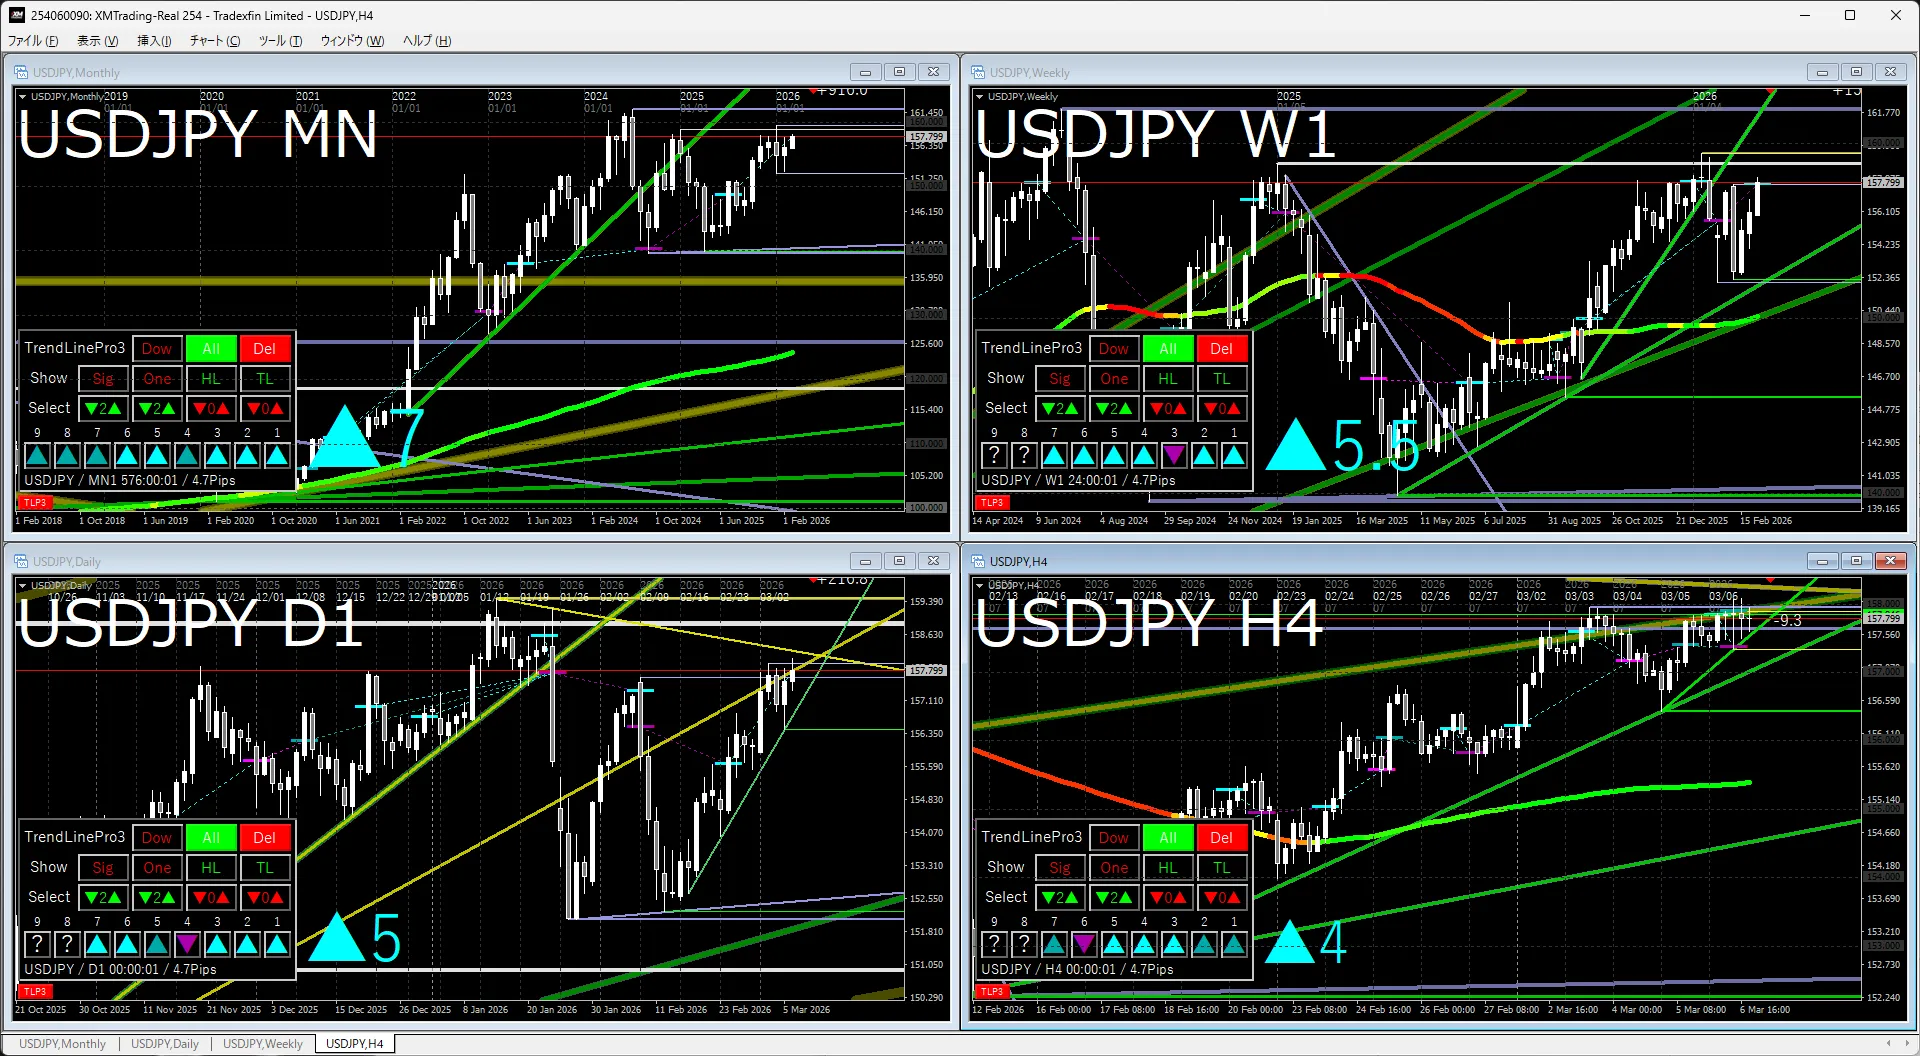
Monthly & WeeklyLong-term, the upward trend has not broken, but it seems to have entered a phase of time-based consolidation. Since the MA is not keeping up, it seems likely the consolidation will continue a while longer.
Daily & 4 hoursPrice action may focus on renewed highs, but depending on the fundamentals, it could go either way. It’s better to stay flexible and not try to predict too rigidly.
Gold
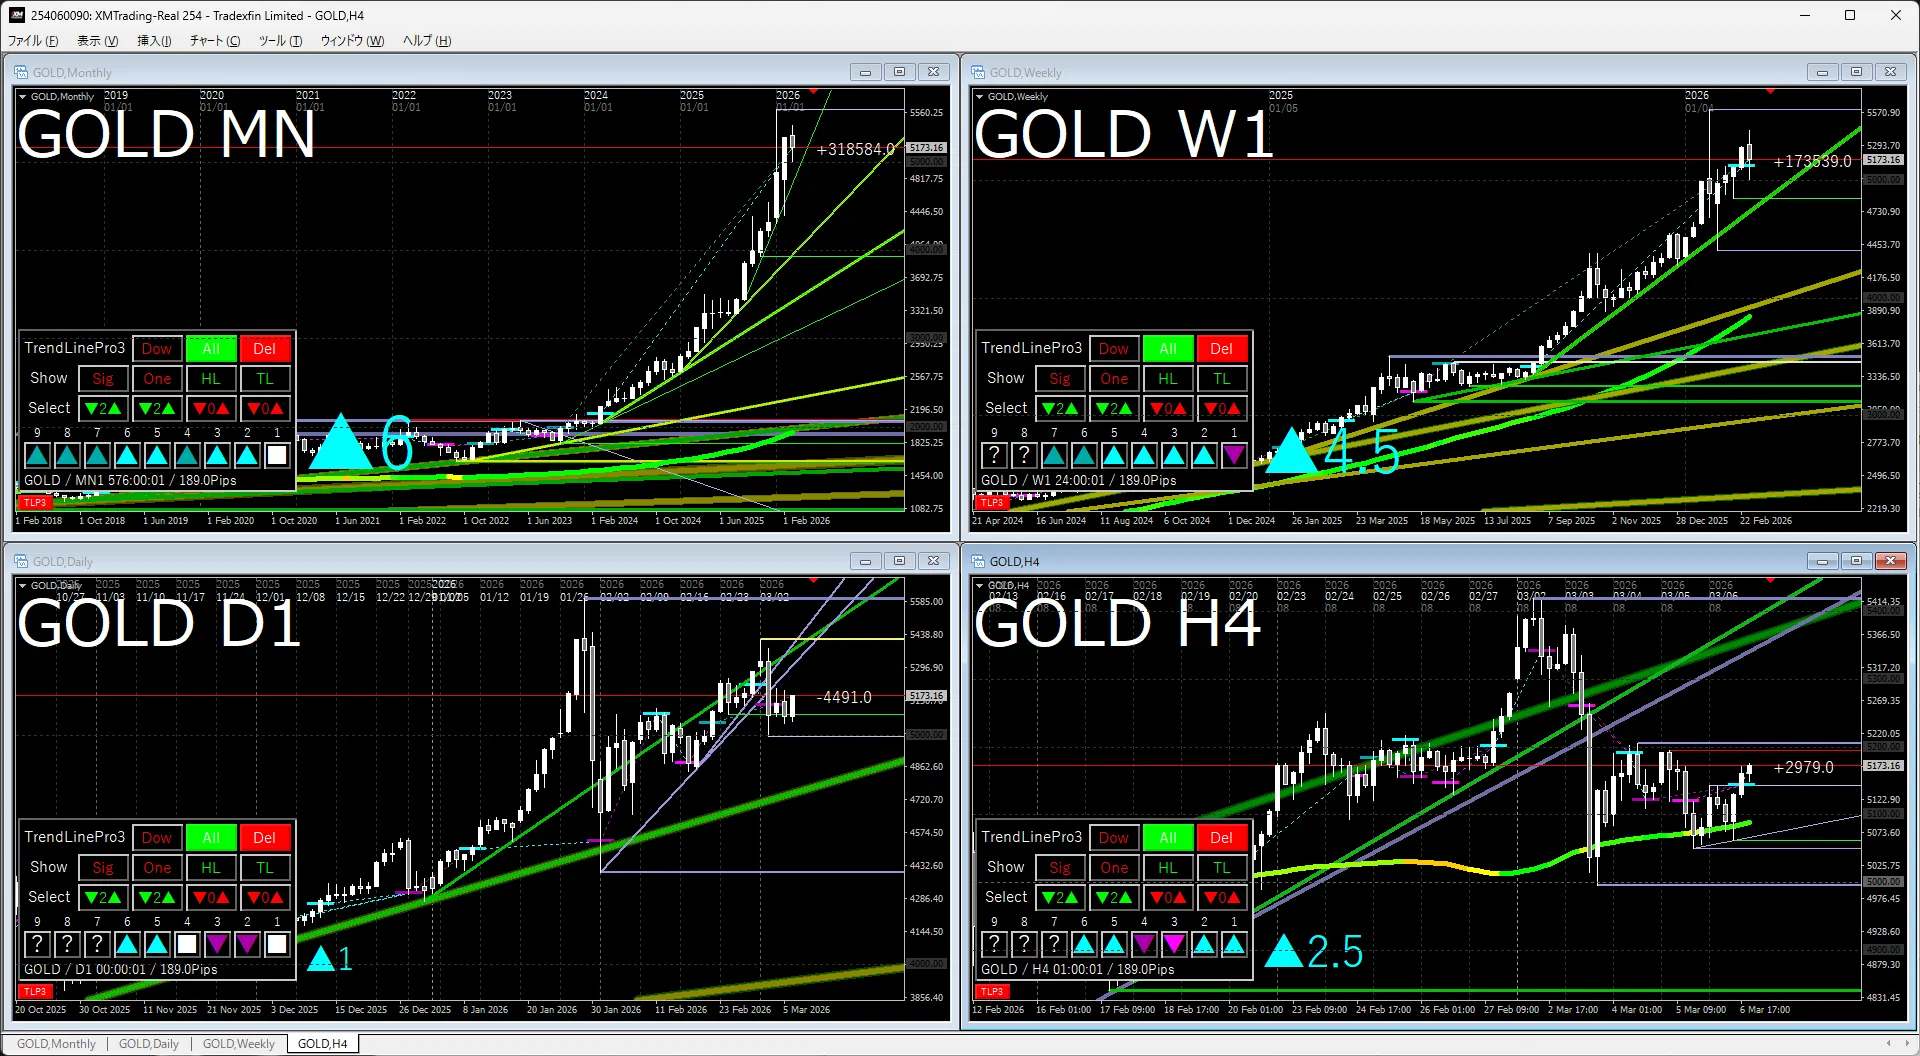
Attention is on the decline in currency value, and gold remains a clear buy. The overheated feeling has cooled, but buying remains strong.
Although the urgency has eased, buying remains strong.
S&P 500
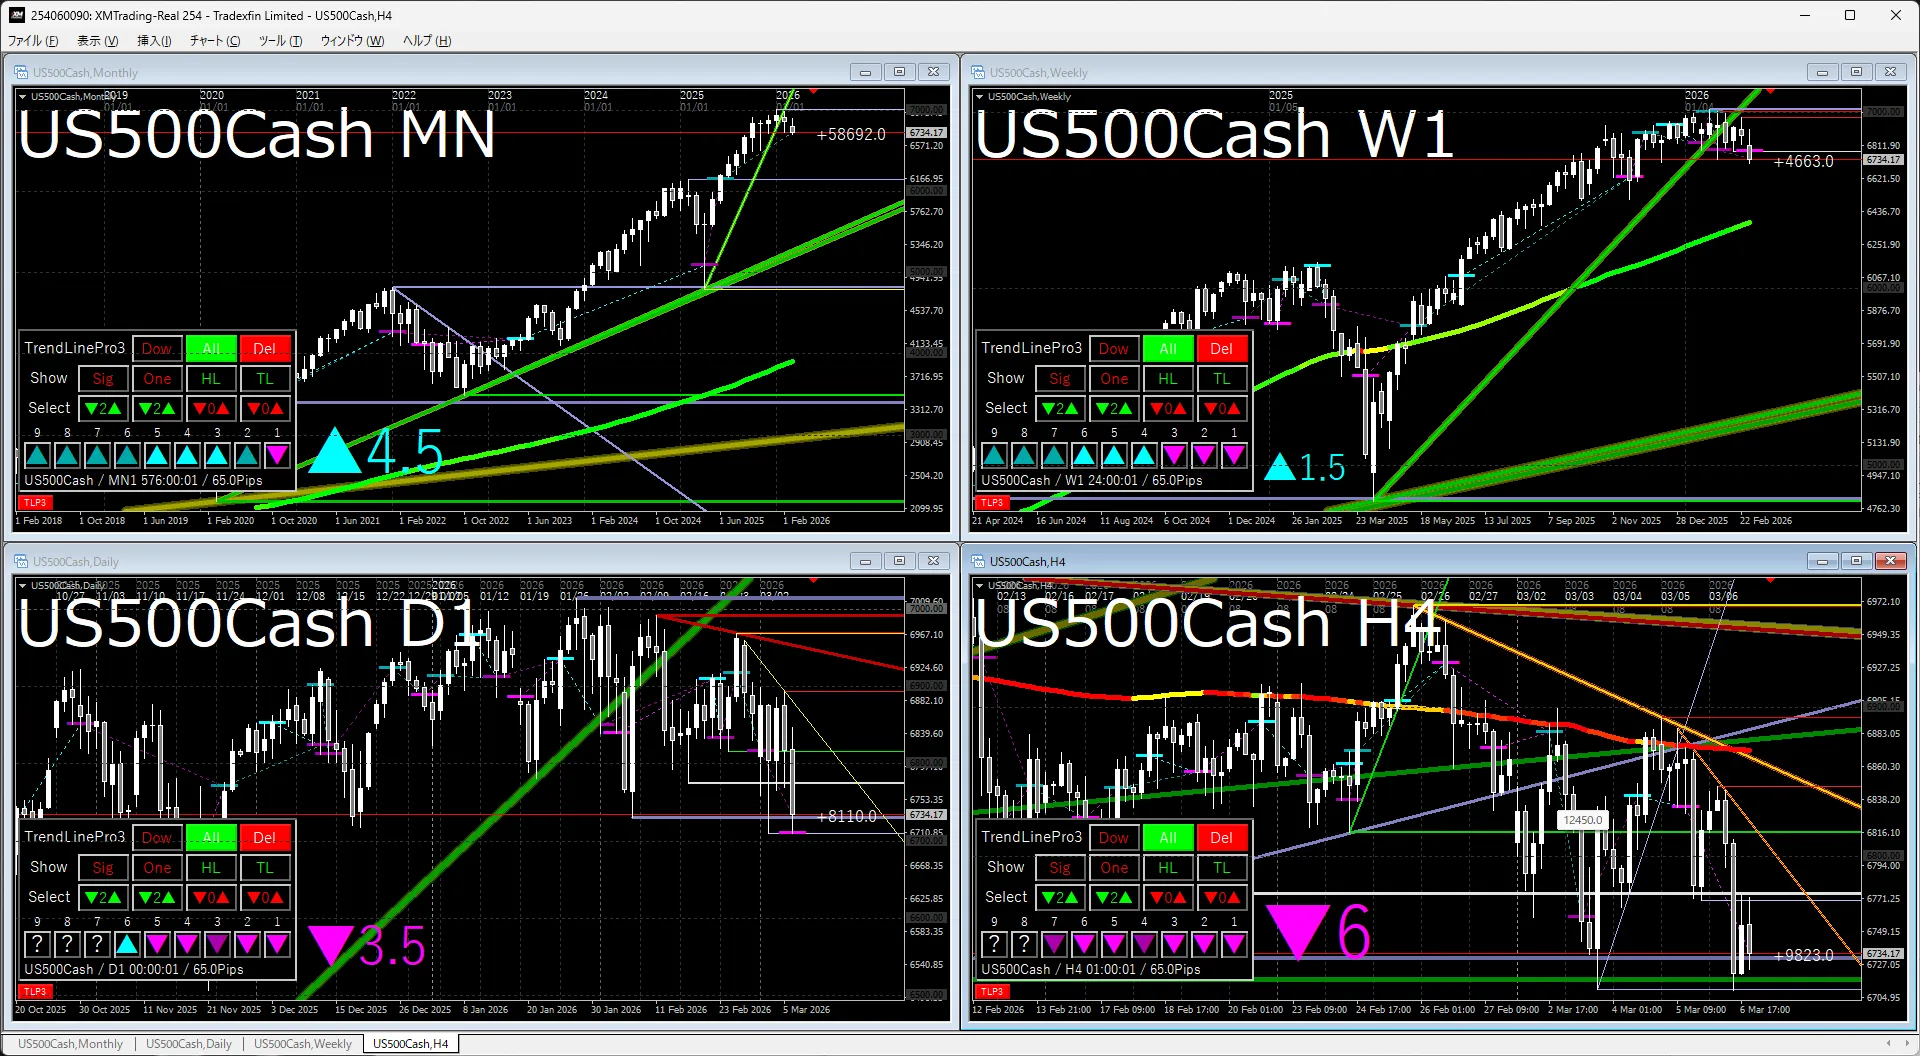
Monthly & WeeklyAfter bouncing from the trendline, the uptrend continues, but there is a possibility it has entered a consolidation phase.
Daily & 4 hoursThere may be some consolidation up to around the weekly MA, but personally I think a sideways trend may continue.
Nikkei 225
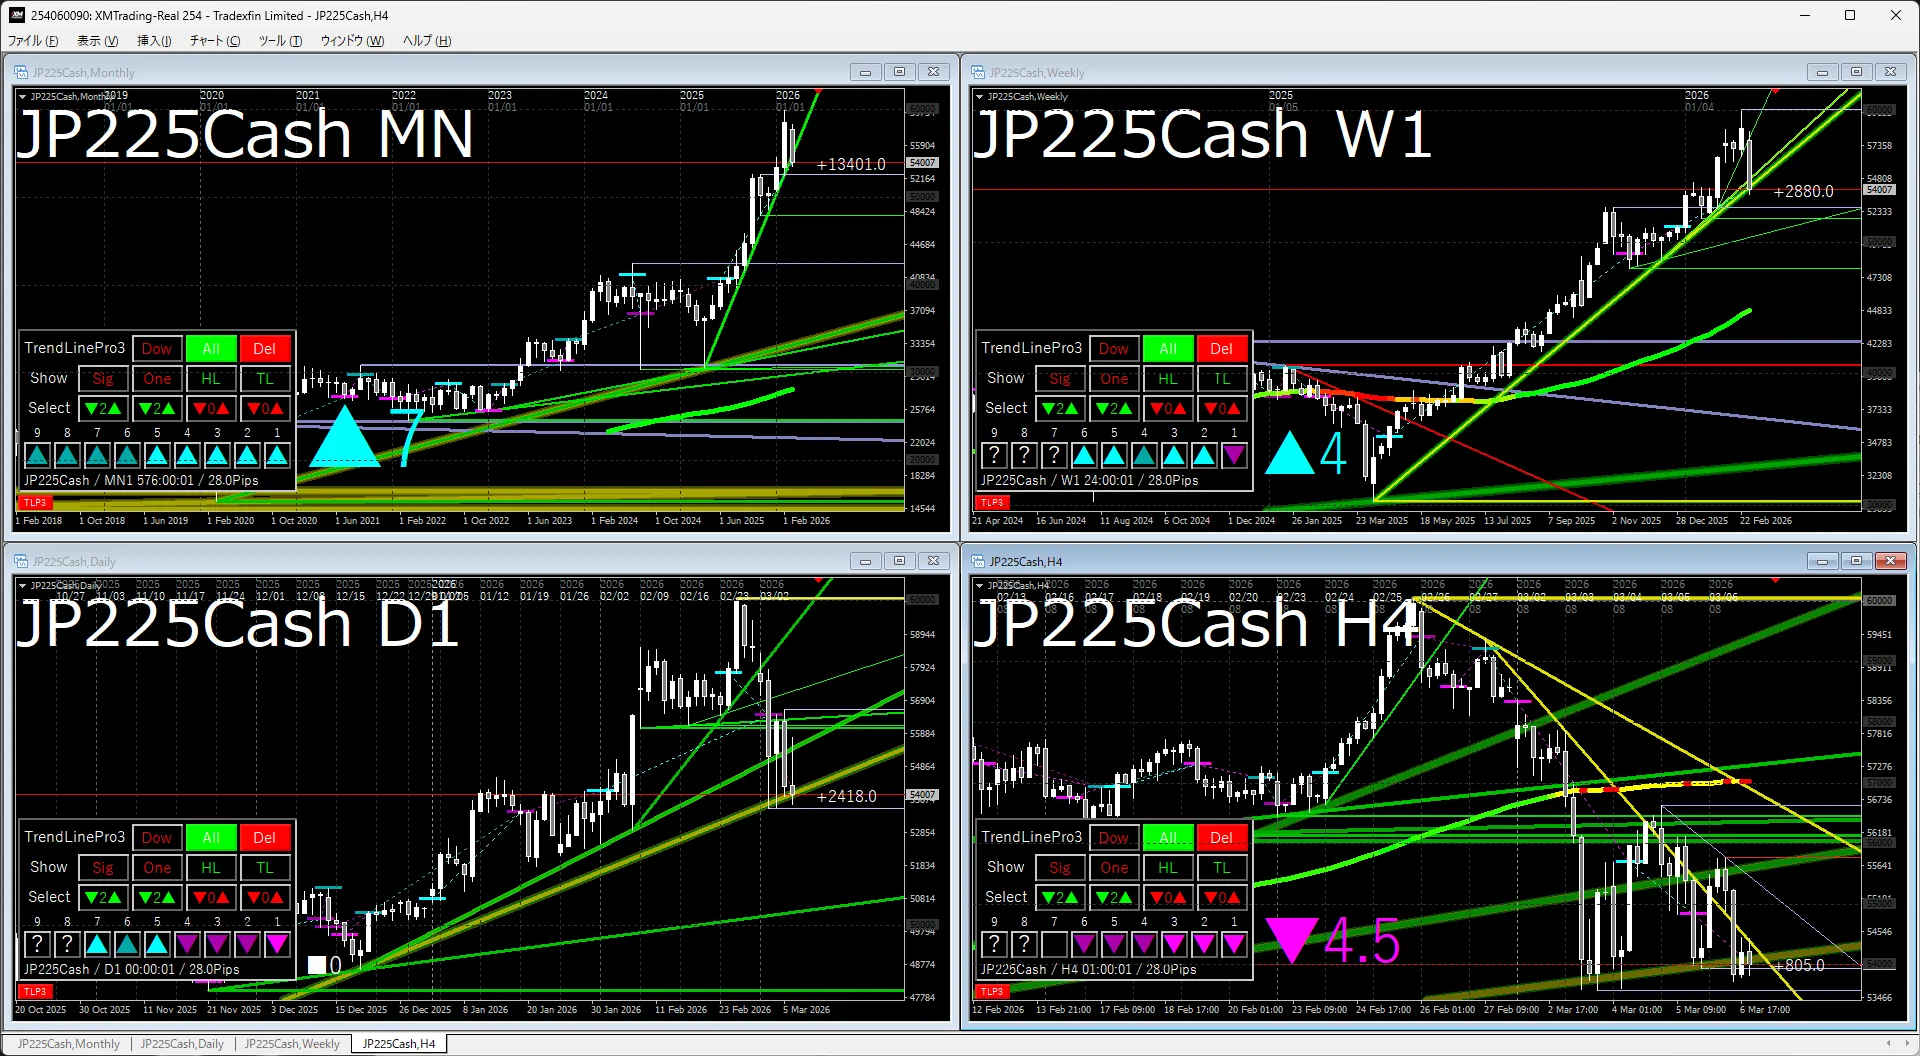
Monthly & WeeklyThe trendline drawn cleanly has been almost broken, but the uptrend has not yet been broken.
Daily & 4 hoursBecause it sits at a commonly watched trendline, expect a sideways hold for a while, but depending on the fundamentals, there is a non-zero possibility of a downturn.
The indicator in the attached image uses the indicators below.
If you’re interested, please take a look.
I’ve added a download button below, but there is no continuation.
If you press it, I will feel energized.