MT5/A sign tool that shows reversals RIPCURRENT

商品概要
コミュニティ(0)
MT5/A sign tool that shows reversals RIPCURRENT  インジケーター・電子書籍
MT5/A sign tool that shows reversals RIPCURRENT
A sign tool that shows entry points and take profit points. No post-trading, no repainting!

日本

フォロー 0フォロワー 6
出品者回航屋
出品者の最終ログイン時間:2024年3月10日 10:03:39
出品者情報をもっと見る
¥2,000クーポン対象商品です。
あと3日でクーポンが失効します。
すべてのクーポン対象商品はこちら
×
¥27,800(税込)
?1クリック注文について
※Web認証が必要となる商品です
A sign tool that shows reversals RIPCURRENT for MT5

  A sign tool that shows entry points and take profit points.
 Easy to install, no numerical settings, no post-trading, no repainting!
 Compatible with range-bound trading, trend following, and trading against the trend!

 When Range
 Enter according to signs on the 15-min chart → Close according to signs on the 5-min chart
 The 15-min chart provides relatively valid signs in the absence of a strong trend.

1.jpg
The image above shows an upward trend. Since the majority are thought to trend toward buying, a series of consecutive signs appear. Therefore, we can predict that trend followers will buy. If you wait for the next 5-min or 15-min interval and enter after confirming that there are no consecutive signs, you will be following the trend. During this time, there are likely to be consecutive signs on the 5-min chart, so it is better to wait for the more probable signs on the 15-min chart.
  When trading against the trend, in addition to using 15-min charts, entering after checking signs on charts with higher time intervals, such as 1-hour charts etc., provides higher precision, but since you are trading against the trend, we recommend also checking other conditions, etc.


    5Min candles
2.jpg
The image above shows the 5-min bars reversing at each single sign. This does not show a clear direction, so it is safer to consider closing while keeping an eye on the signs on the 1-min chart.


   One hour candles
3.jpg
Similarly, if there are no consecutive signs on the 1-hour chart without a pause, then there is likely little resistance. In addition, if a series of signs appear in similar locations, there is a possibility of a reversal.


Enter when the signs opposite from the consecutive signs are in a similar position, held back by fewer signs, etc.


1Min candles
3.jpg 
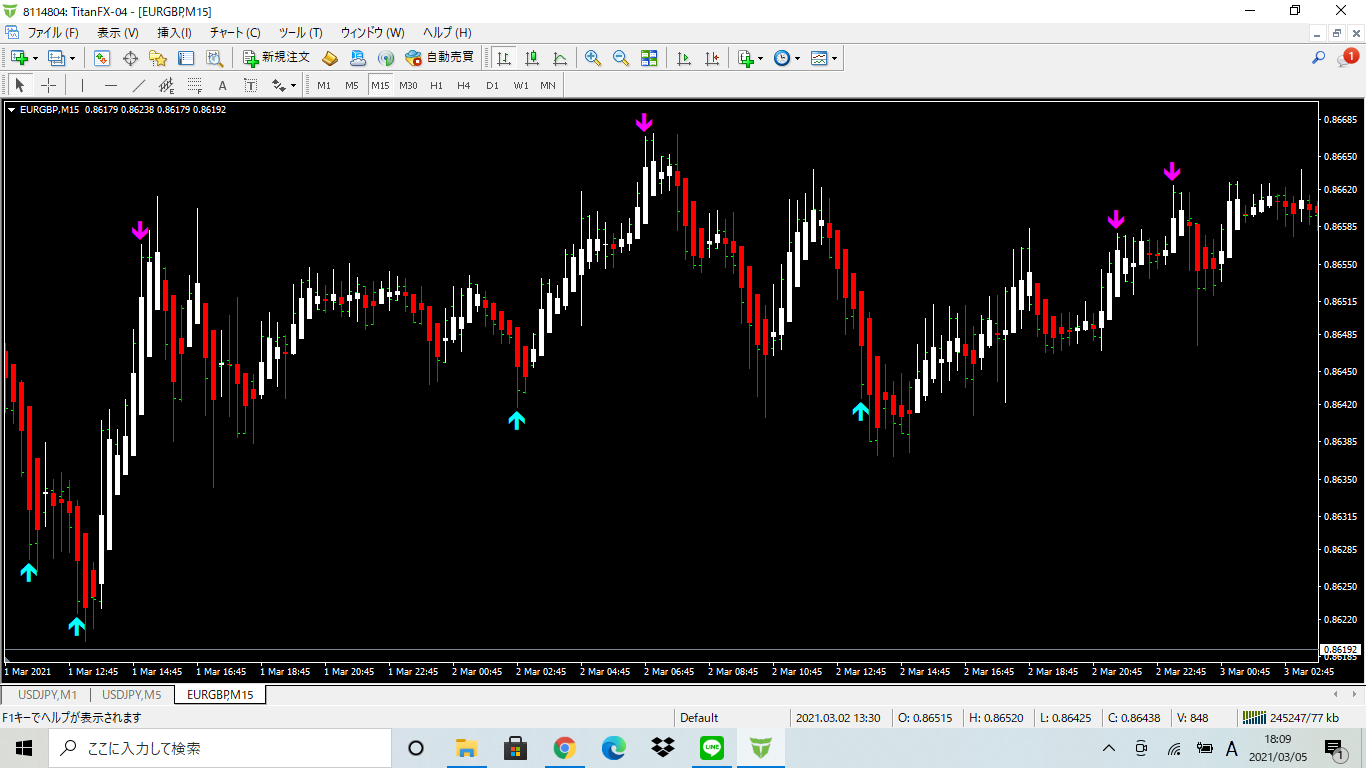
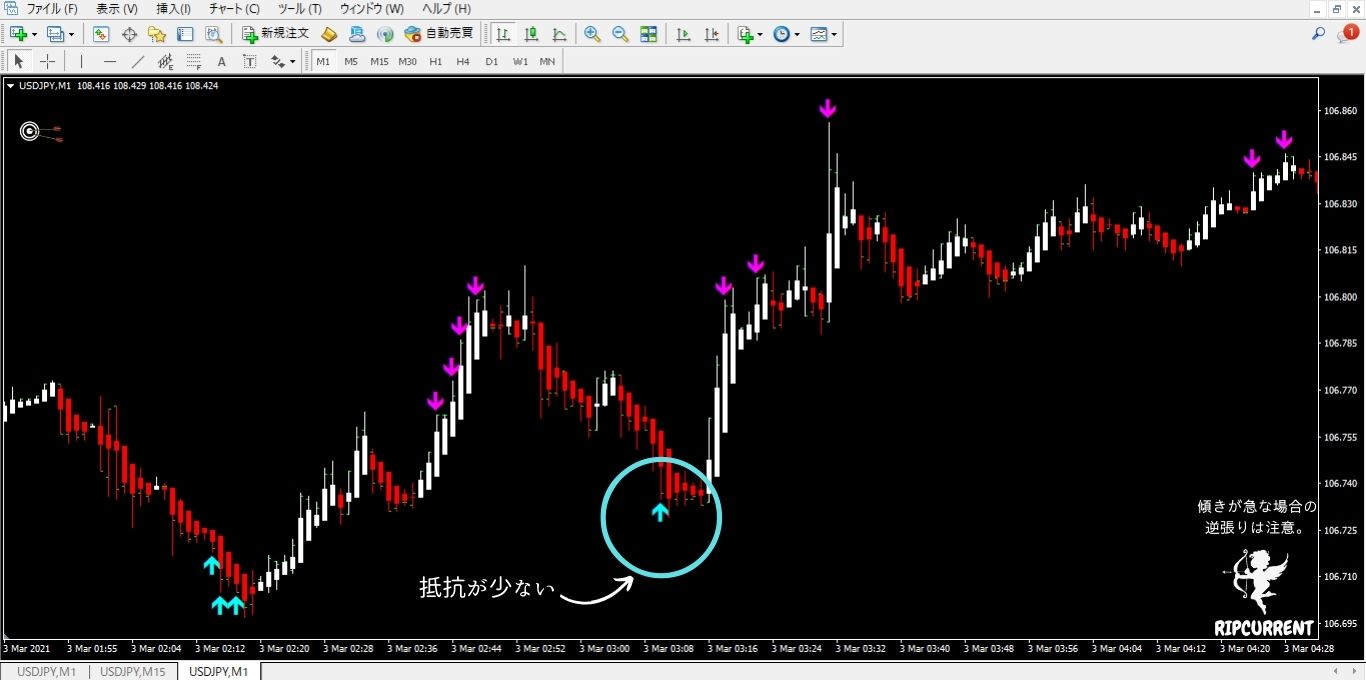
The image above shows the timing on the 1-min chart to get the result you want. The three signs on the left side are consecutive, but they have appeared in a similar location. Once you are used to it, you can try it out, but until you are used to it, it would be safer to forgo it for the time being. 


    When Trend occur
 Trend follow
6.jpg
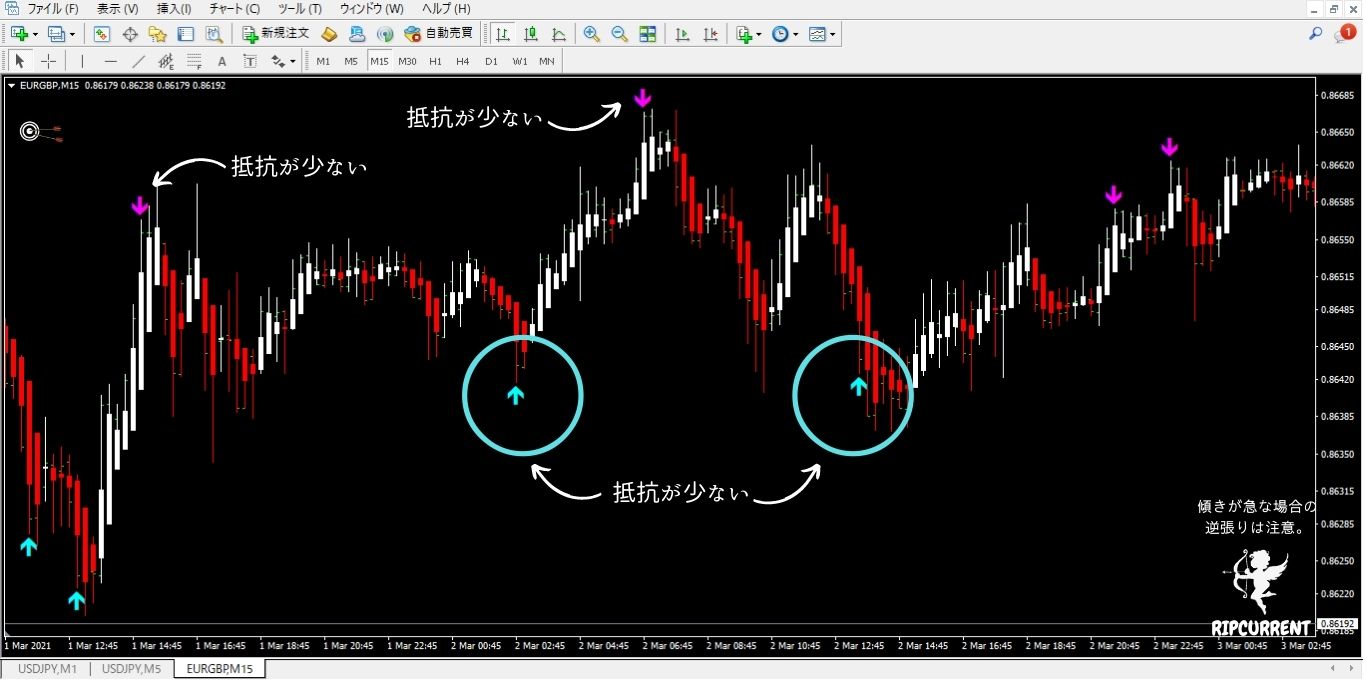
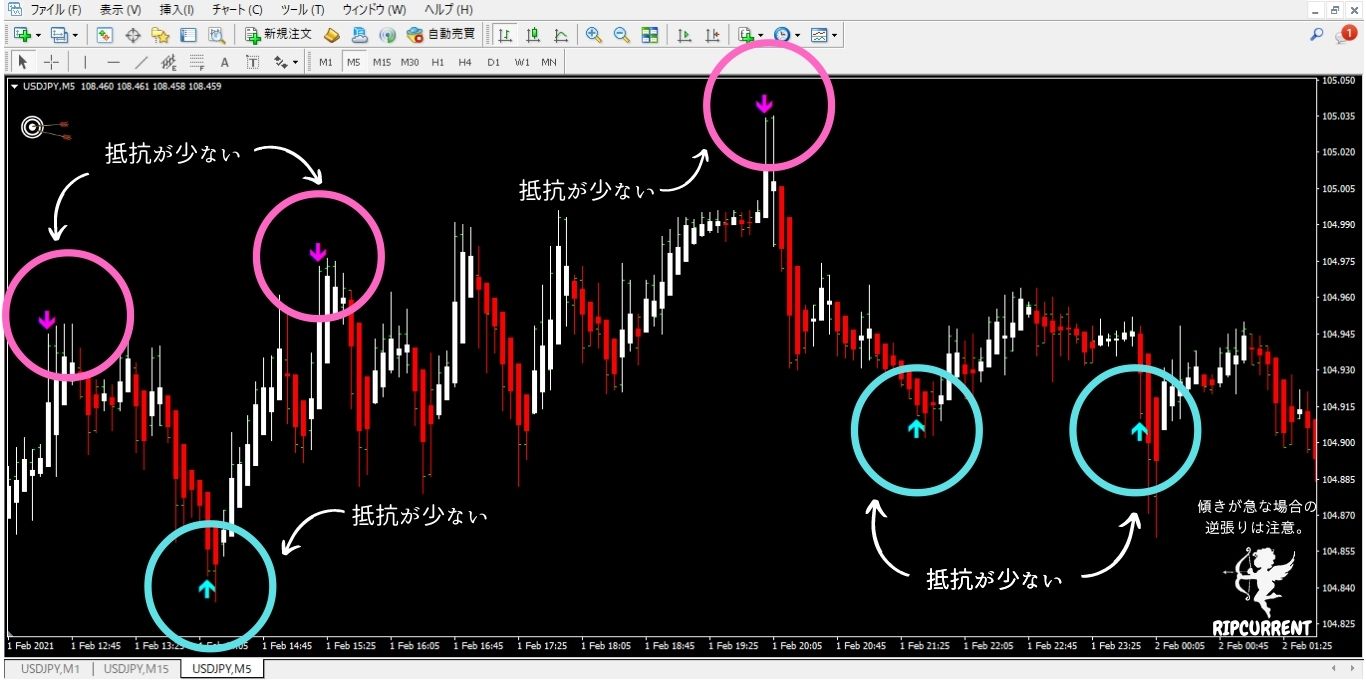
It is reversing very clearly at a single sign and informing you of the timing to get the result you want.
 

Enter according to signs on a chart with a higher time interval, such as a 15-min or 1-hour chart, showing a rise → Close according to signs on the 1-min and 5-min charts.

When in the direction of the trend, it is difficult to get a sign on a chart with a higher time interval going in the opposite direction (for example, if the trend is upward, it is rare for a sign to appear on a 5-min or higher chart during a temporary drop), so it is better to judge when to close using the 1-min chart, etc.


When trading against the trend, in some cases, it is better to enter at the second wave of signs rather than at the first wave.


 7.jpg
 When trading against the trend during a period of strong momentum, it is sometimes difficult to get a reverse even when signs appear.  It is a bit like trying to swim against the current in a fast-moving river.

As a general rule, this indicator tends to appear at the point where the minority and the majority are focusing attention. However, when trading against the trend, we recommend that you keep an eye on the signs on the multi-hourly charts and the slope of the trend line as well.


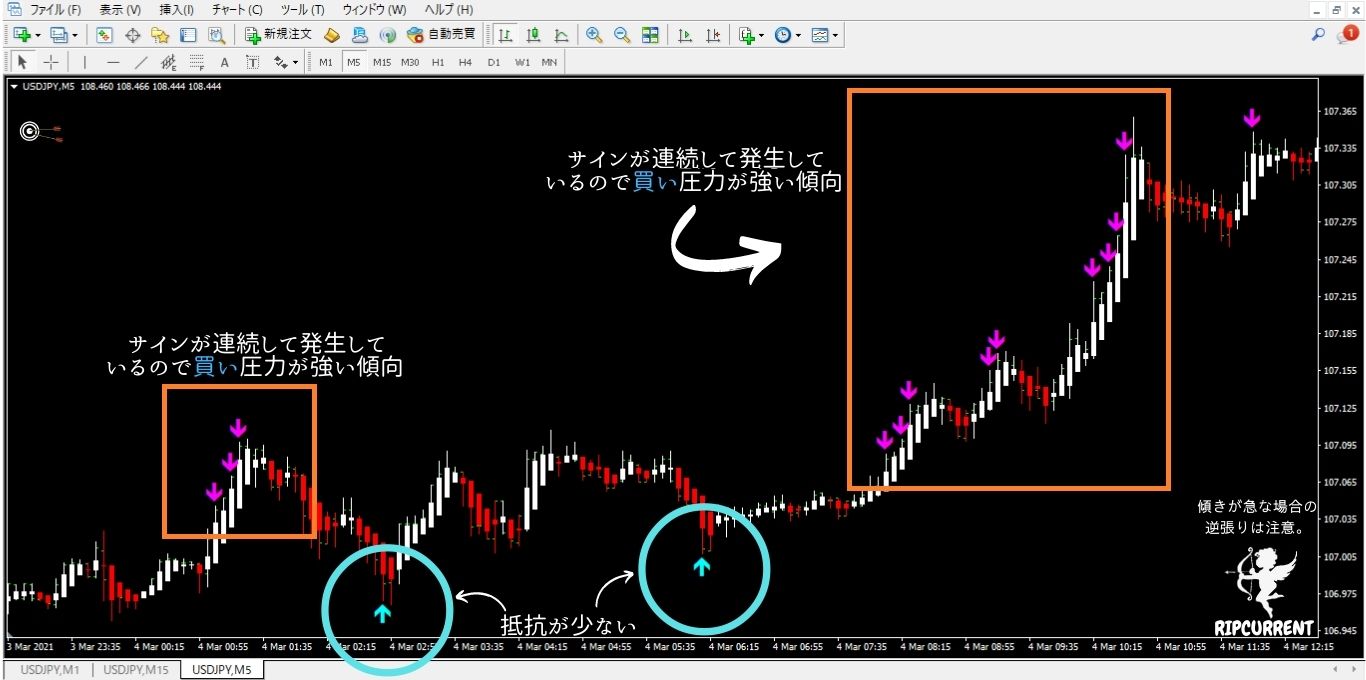
It is safer to forgo trading against the trend when signs appear in rapid succession without a pause.

 
 6.jpg
 The image above shows how signs appeared during a sharp fluctuation in FY2021.

The one-hour-long candles have been shortening for a very long time. There are some adjustments here and there, but there is no clear point of decline.

At a time like this, it might be better to wait for a chance to enter that follows the trend.

Signs are also continuing to appear on charts with other time intervals.

Incidentally, signs of reversal appeared on the weekly and monthly charts prior to this rise.


     15Min candles9.jpg
 When the direction is undetermined, during adjustments, or when the ceiling or floors of charts with higher time intervals are stagnant, etc., the 15-min chart provides good signs for both rises and drops.  The image shows a rising pattern, but there are of course times when it drops.


As you get used to trading, you can add elements such as Fibonacci, Bollinger Bands, trend lines, etc. to ascertain changes in market trends with even greater precision.


Since these ascertain the characteristics of candles, they can also be used with a variety of currencies.
Please be sure to try these on the chart of your favorite currency pair, and use them if you find signs at a good point.

Example EuroGBP 15分足
EURGBP.png
¥27,800(税込)
?1クリック注文について
商品概要
コミュニティ(0)
人気商品ランキング
おすすめ商品(キャンペーン商品)

GogoJungleを初めてご利用する方へ商品のご利用まではかんたん3ステップ!

GogoJungleでは、会員様向けに、あなたの投資生活を豊かにするサービスをご用意しております。また、商品のご購入は通常会員様に限られさせていただいております。今すぐ会員登録をして、Gogojungleを活用してみませんか!

01
ユーザー情報を入力し会員登録
02
案内に従い購入
03
マイページからダウンロード
商号 株式会社ゴゴジャン
金融商品取引業の登録番号 関東財務局長(金商)第1960号
加入協会 一般社団法人 日本投資顧問業協会
商号 株式会社ゴゴジャン
金融商品取引業の登録番号
関東財務局長(金商)第1960号
加入協会 一般社団法人
日本投資顧問業協会
金融庁日本投資顧問業協会証券・金融商品あっせん相談センター証券取引等監視委員会

Copyright © 2024 GogoJungle Inc. All Rights Reserved.