

"ATS-25" Lecture Part 1: "How to Read Live Streaming DataBank"
Thank you for always using our service, and many thanks.
This time we will explain theライブ配信の「DataBank」.
■ What is the DataBank for live distribution ■
In your ATS system, when you open MT4 or press the “UpDate” button, a search starts, and only the optimal value for the current time period is selected. And the backtest results are displayed.
This enables trading with settings suited to the current situation.
In the DataBank you view in the live distribution, this operation is not only for the current time period, but is divided into 24 hours of the day, and search and backtest are performed for all times.
Whether the target time is just now or all times varies, but the internal processing itself is the same.
However, although the processing is the same, the purpose is different.
In ‘ATS-25’, it is preparation for trading (position acquisition) adapted to the current situation.
And the DataBank aims to indicate which currency pair × time frame is the target and when.
■ How to read the DataBank 1 ■
We will now explain where the targets are in the current time period.
Before starting the system and beginning trading, calm yourself and look at the DataBank.
Alternatively, for those who can use time freely, it is very effective to decide in advance the time to trade (position acquisition) for a specific currency pair × time frame, and start trading when that time comes.
Where in the DataBank is the target.
We will explain from the basic criteria we are using now.
First, please learn the basics.
Among the data displayed by time, look at the “Point.”
This is the total value of backtests conducted for the optimal value in each time period.
For “AUDJPY”, around “1000” corresponds to “1 yen (=100 pips).”
Gold color indicates positive, red indicates negative.
Therefore, as a basic rule, the criteria for deciding whether to trade are as follows.
----- ----- ----- ----- -----
In the case of “AUDJPY”
・5-minute chart = 500 Points or more
・15-minute chart = 1000 Points or more
・30-minute chart = 1000 Points or more
・1-hour chart = 2000 Points or more
----- ----- ----- ----- -----
Here, depending on the currency pair rate, a slight adjustment is made.
Since “AUDJPY” is about 98 yen, the ratios are
“EURJPY” is 1.7x, “USDJPY” 1.5x, “EURUSD” 1.2x, “GBPJPY” 2x, etc.
(as of September 15, 2025)
We don’t perform extremely strict calculations, but the results can still be obtained, so you don’t need to think too hard.
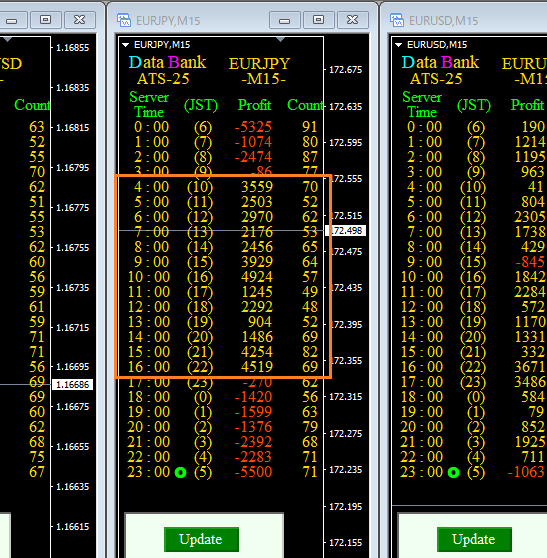
■ DataBank Reading 2 ■
When you find a time period where the Point meets the standard in DataBank, look at the surrounding values.
If the surrounding values are not negative, adopt them.
If you are sandwiched by red minus numbers, you will be careful even if the Point is high.
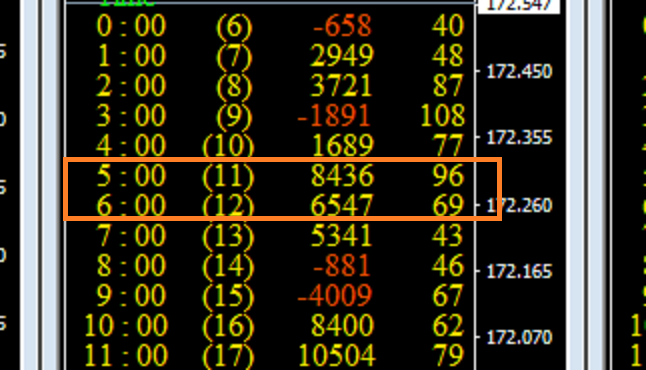
■ DataBank Reading 3 ■
If there is a large rise sustained for a long time as in the diagram, we interpret a strong trend coming.
Be mindful of the zone and target that time period for trading; it is very effective.
This time was about the DataBank during the live distribution.
In the published trading results, times that meet these criteria may be acquired even outside the specified periods.
We will explain that in order later.
First, let's firmly learn the basics.
× ![]()