

【BTCJPY】20190201 Daily Pivot
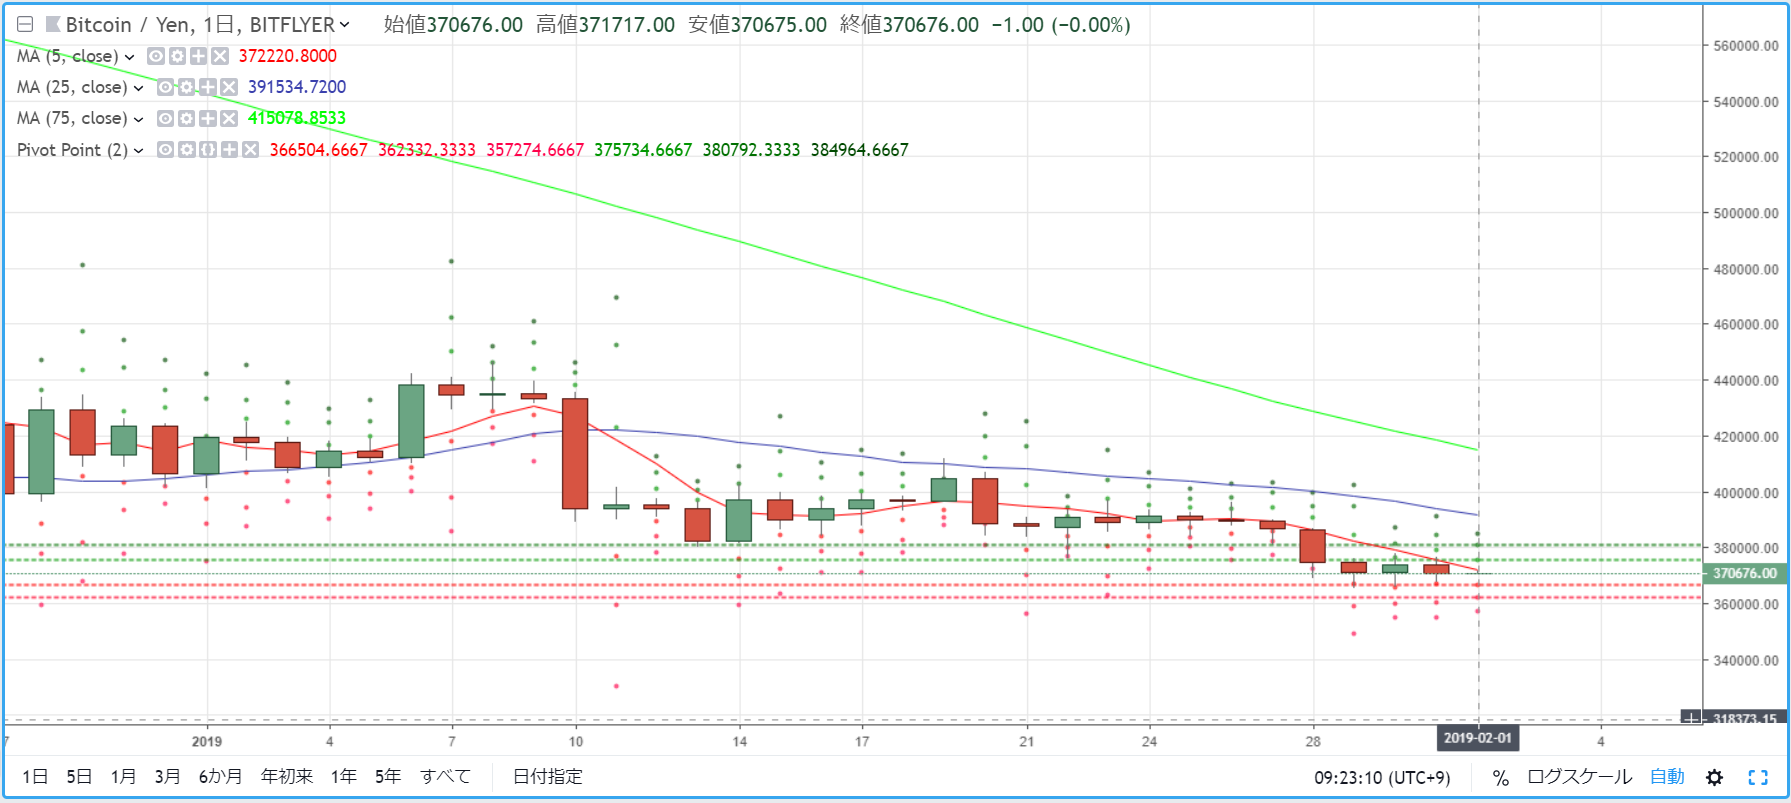
R2=380,792
R1=375,734
S1=366,504
S2=362,332
※ Pivot points are technical indicators that estimate the price movement for the day based on the previous day's activity. Centered on the Pivot Point (PP), draw Resistance lines (R1, R2) and Support lines (S1, S2) above and below, and use them as trading references.
【Calculation Formula】
Pivot Point (PP) = (Previous day's close + high + low) / 3
Resistance Line 1 (R1) = PP + (PP - Previous day's low)
Support Line 1 (S1) = PP - (Previous day's high - PP)
Resistance Line 2 (R2) = PP + (Previous day's high - previous day's low)
Support Line 2 (S2) = PP - (Previous day's high - previous day's low)
(Replace this section for publication to buyers)


