

【BTCJPY】20190215 Daily Pivot
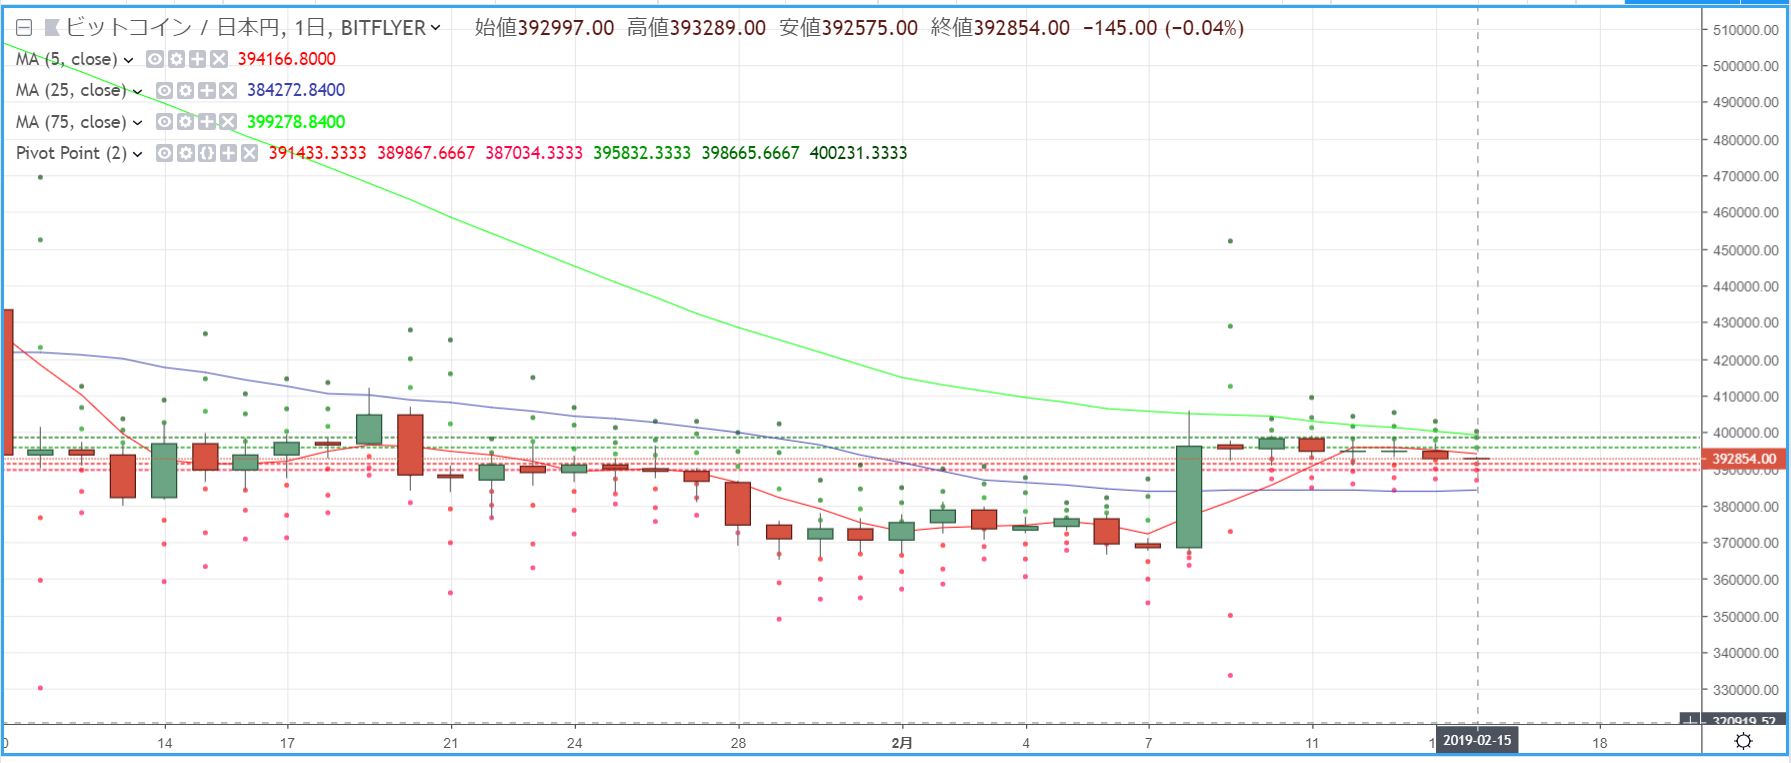
R2=398,665
R1=395,832
S1=391,433
S2=389,867
※ A pivot point is a technical indicator that predicts the price movement for the current day based on the previous day's price action. Centered on the Pivot Point (PP), resistance lines (R1, R2) and support lines (S1, S2) are drawn above and below, and they are used as trading benchmarks.
【Calculation formulas】
Pivot Point (PP) = (Previous day's close + previous day's high + previous day's low) / 3
Resistance Line 1 (R1) = PP + (PP - previous day's low)
Support Line 1 (S1) = PP - (previous day's high - PP)
Resistance Line 2 (R2) = PP + (previous day's high - previous day's low)
Support Line 2 (S2) = PP - (previous day's high - previous day's low)


