

【BTCJPY】20190131 Daily Pivot
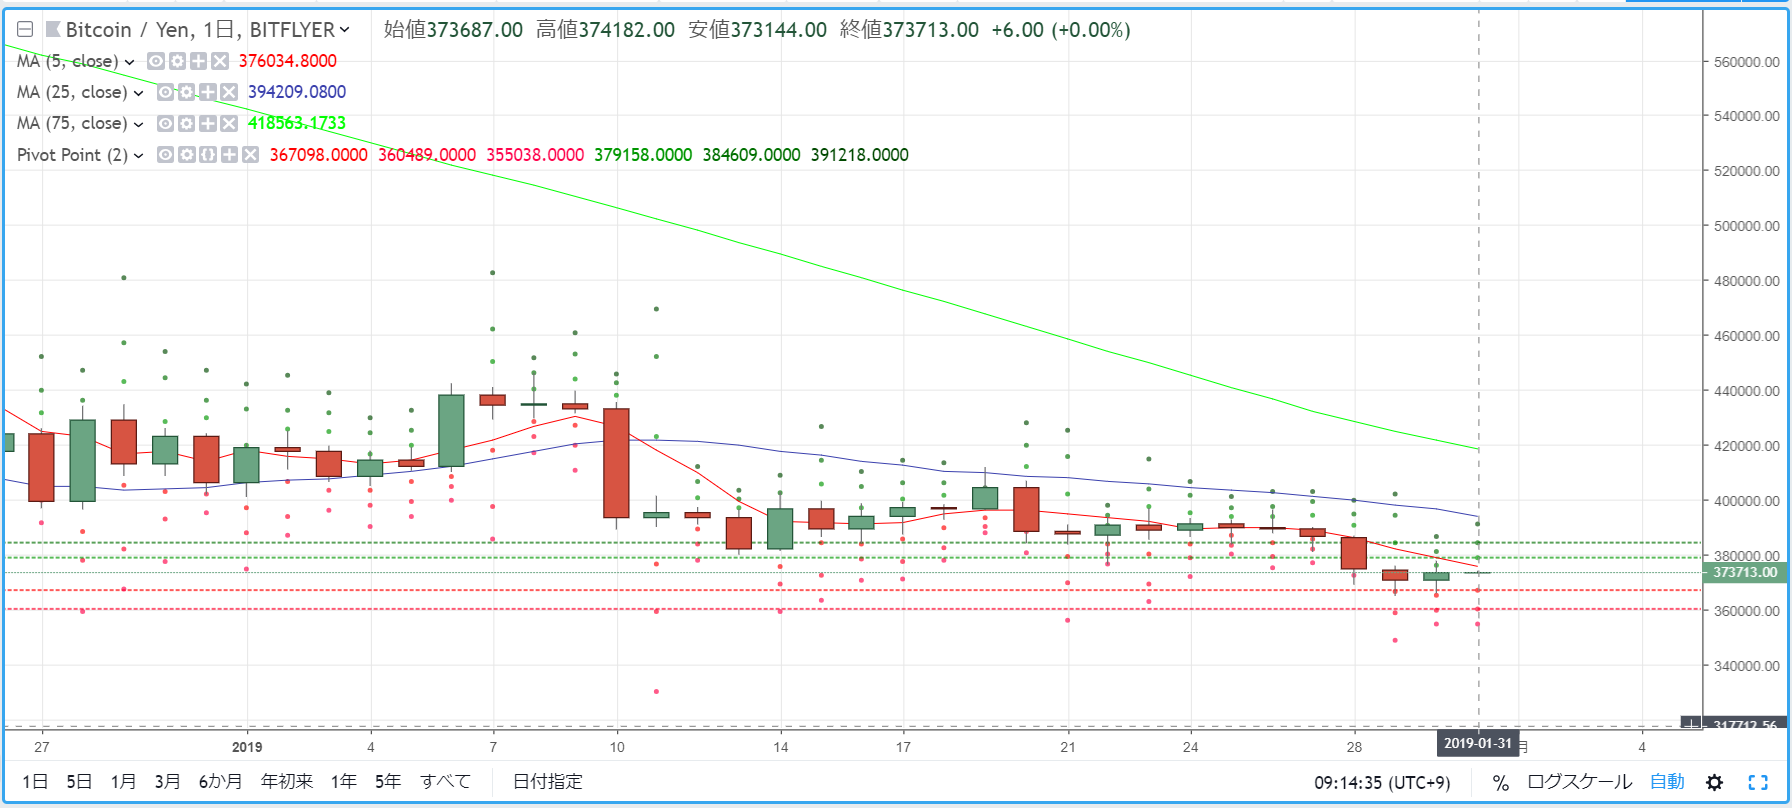
R2=384,609
R1=379,158
S1=367,098
S2=360,489
※ A pivot point is a technical indicator used to predict the range of price movement for the current day based on the previous day's price action. Centered on the Pivot Point (PP), draw resistance lines (R1, R2) and support lines (S1, S2) above and below, using them as trading references.
【Calculations】
Pivot Point (PP) = (yesterday's close + yesterday's high + yesterday's low) / 3
Resistance Line 1 (R1) = PP + (PP - yesterday's low)
Support Line 1 (S1) = PP - (yesterday's high - PP)
Resistance Line 2 (R2) = PP + (yesterday's high - yesterday's low)
Support Line 2 (S2) = PP - (yesterday's high - yesterday's low)


