
[Beginner] Technical Course | RSI (Indicator Free)
[Beginner] Technical Course|RSI(Relative Strength Index)
RSI(Relative Strength Index)is a representative oscillator indicator that visualizes market “overbought/oversold numerically. On a scale from 0 to 100, it helps gauge strength, and traders worldwide use it as a guide for range-bound pullbacks and reversal moments.
RSI Basics
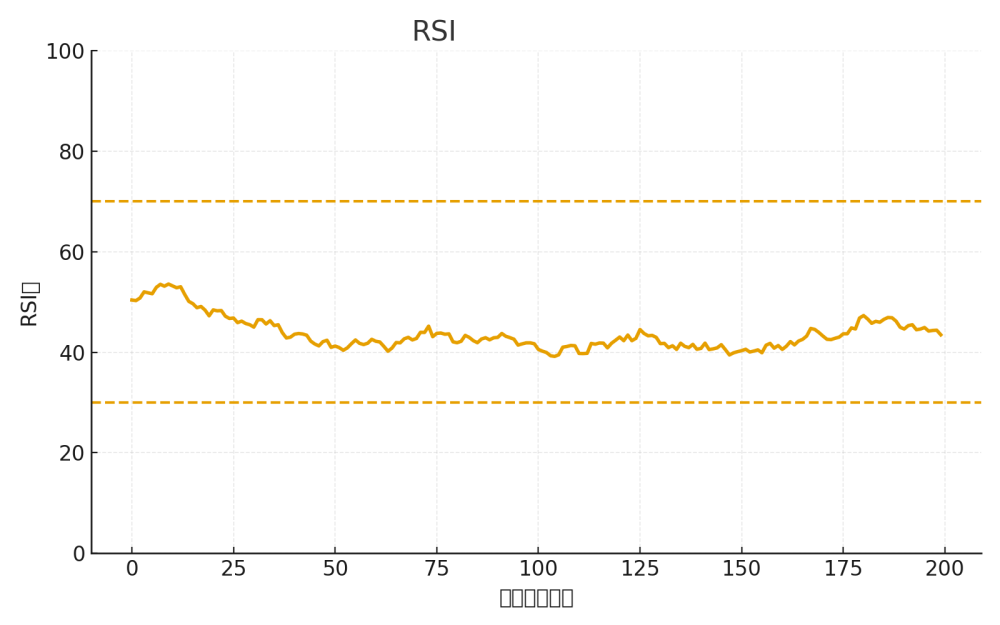
- Value range:0–100
- General thresholds:
- 70 or higher… Overbought (watch for a pullback)
- 30 or lower… Oversold (watch for a rebound)
- Concept:Ratio of gains to losses over a periodquantifies market strength
Practical Ways to Gain an Edge
- Divergence
When price makes a new high (or low) but RSI does not, it signals momentum waning. Watch as a potential reversal signal. - Match to market condition
Range market: 70/30 works well.
Strong trend market:80/40and60/20, slightly shifting thresholds to reduce false signals. - In conjunction with context
RSI indicates timing, not direction alone.Higher-level context(direction or zones) filters improve accuracy.
ZoneBreaker Core × RSIexample combination:
In ZoneBreaker Core, a “buy bias” zone→ Look for RSI to rise from around 30–40.
In ZoneBreaker Core, a “sell bias” zone→ Look for RSI to fall from around 60–70.
The key is to divide duties between direction (environment) and timing (RSI).
Summary
- RSI is the classic indicator that quantitatively captures“overbought/oversold”.
- Effective in range markets; in strong trends, adjust the reference values
- Do not rely on it alone.Use with environment awareness × timingfor best results
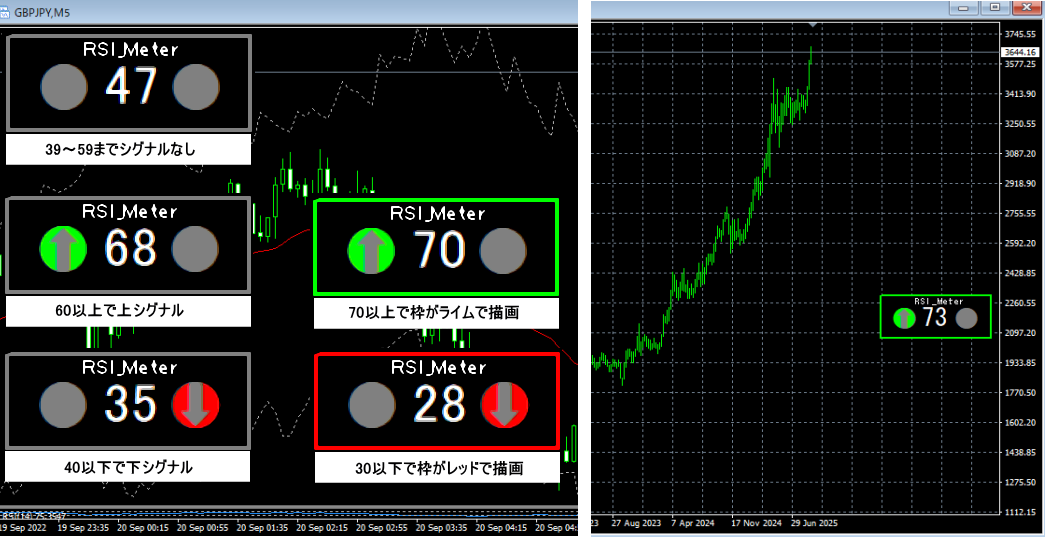
RSI Meter free gift! Click “Read more” below to download.