

【BTCJPY】20190130 Daily Pivot
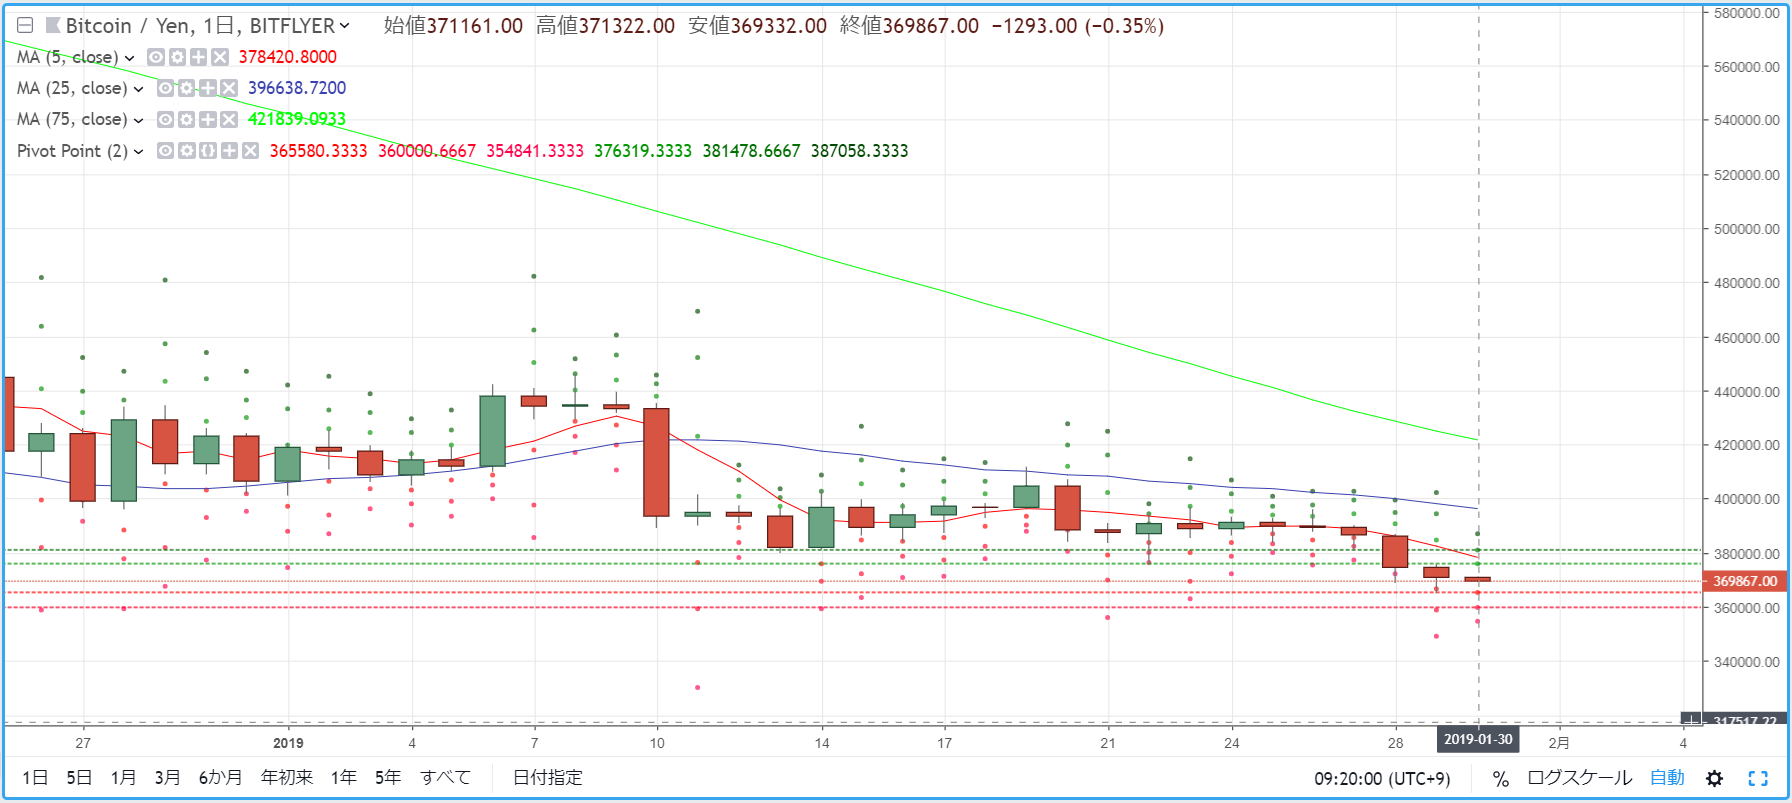
R2=381,478
R1=376,319
S1=365,580
S2=360,000
※ A pivot is a technical indicator that forecasts the price movement for the day based on the previous day's price action. Centered on the Pivot Point (PP), draw resistance lines (R1, R2) and support lines (S1, S2) above and below, and use them as trading references.
【Calculation】
Pivot Point (PP) = (previous day close + high + low) / 3
Resistance Line 1 (R1) = PP + (PP - previous day low)
Support Line 1 (S1) = PP - (previous day high - PP)
Resistance Line 2 (R2) = PP + (previous day high - previous day low)
Support Line 2 (S2) = PP - (previous day high - previous day low)


