

【BTCJPY】20190128 Daily Pivot
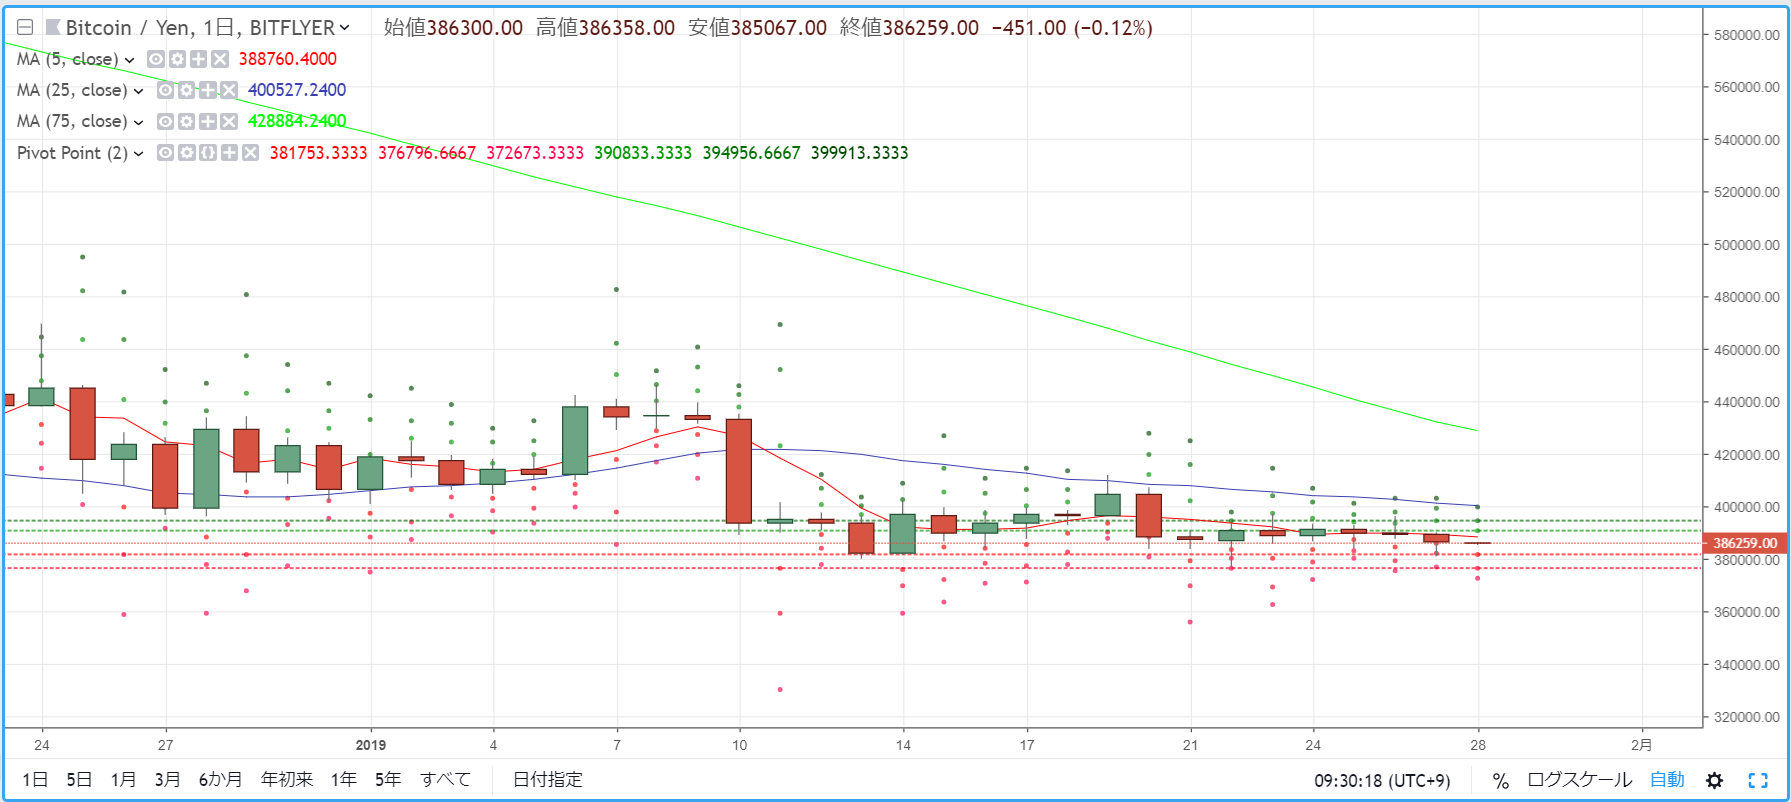
R2=394,956
R1=390,833
S1=381,753
S2=376,796
※ Pivot points are technical indicators used to forecast the price range for the day based on the previous day's price movement. Centered on the Pivot Point (PP), resistance lines (R1, R2) and support lines (S1, S2) are drawn above and below, and these are used as trading guidelines.
【Calculation formulas】
Pivot Point (PP) = (Previous day's close + high + low) / 3
Resistance Line 1 (R1) = PP + (PP - previous day's low)
Support Line 1 (S1) = PP - (previous day's high - PP)
Resistance Line 2 (R2) = PP + (previous day's high - previous day's low)
Support Line 2 (S2) = PP - (previous day's high - previous day's low)


