Bolinger Bands FX Method January 26
How to read Bollinger Bands: USD/JPY Monthly Chart (Forecast for next week)
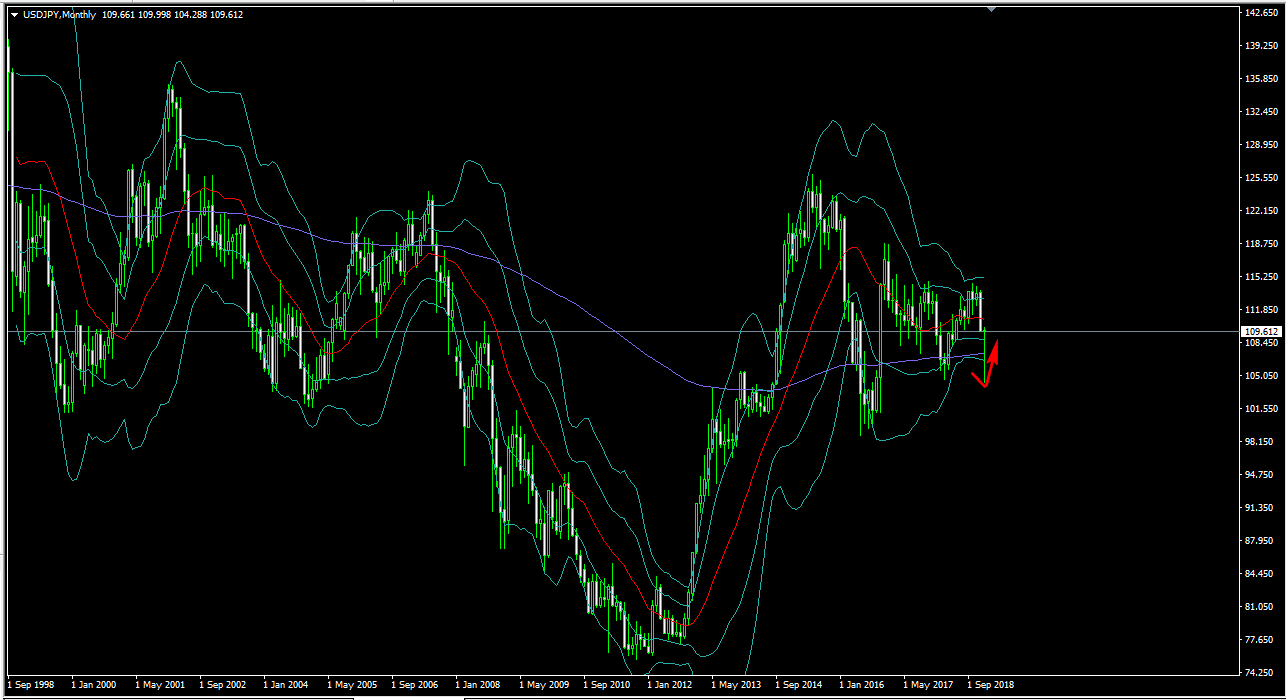
As for the interpretation of Bollinger Bands on the USD/JPY monthly chart, the Bollinger Band -1σ, -2σ, and the purple 200 MA were briefly breached, but all of them pushed back, and the current candlestick has formed a pin bar. It is currently located between the middle band and -1σ, so it is notable whether it will continue upward on a rebound or remain in a range between the middle band and -1σ.
× ![]()