Bollinger Band FX Method View USDJPY May 4
How to read Bollinger Bands: USD/JPY Monthly Chart (Forecast for next week)
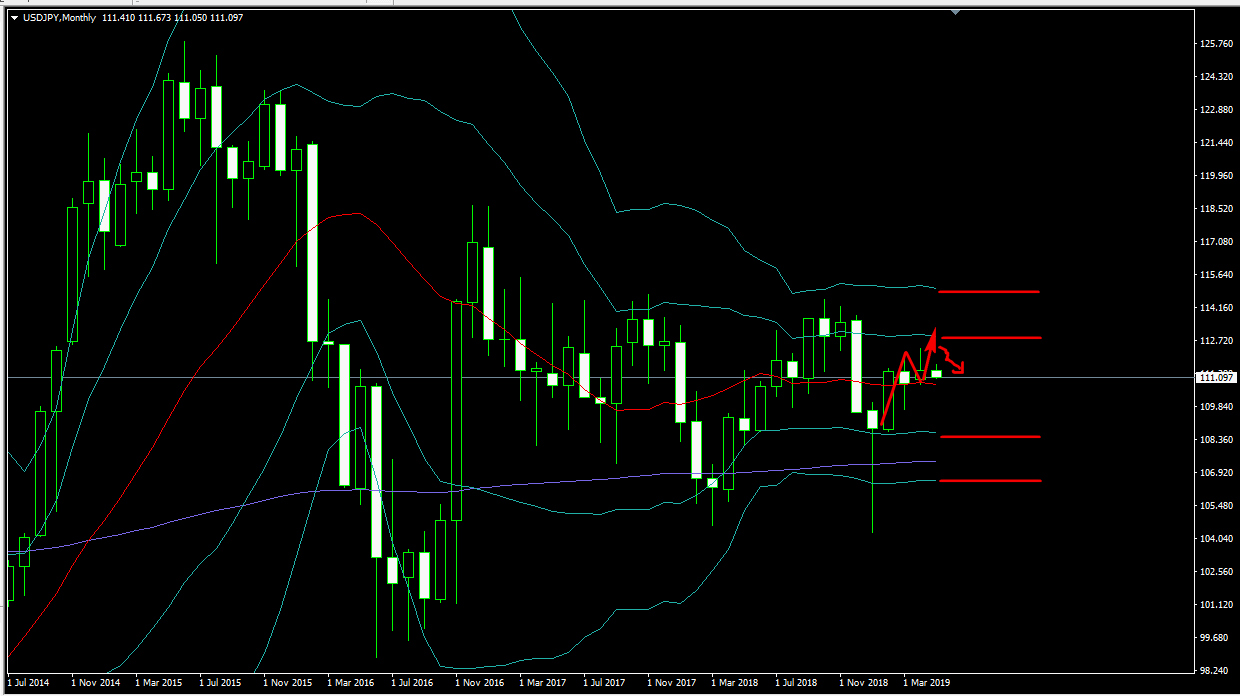
As for the interpretation of Bollinger Bands for USD/JPY on the monthly chart, the bands are almost flat from -2σ to +2σ, indicating a range-bound state. The red line, which is the middle band and the 20-period moving average (20 MA), appears to be functioning as a support line. Three candles ago, a bearish candle appeared, but it was halted there, and in the next candle there was a bounce and a bullish candle with upward momentum. It seemed that it would reach the +1σ of the Bollinger Bands, but before reaching it it stalled and has since formed a bearish candle again, returning to the red 20 MA. The current situation shows that the previously rising highs are now turning lower, suggesting that upside momentum has been delayed or hindered.
What are the next week's forecasts for Bollinger Bands on the weekly and daily charts? What are the FX methods using Bollinger Bands? Practical records are also published! Continue reading