
[Beginner] Technical Seminar | Parabolic SAR (Parabolic SAR)
Technical Course|Parabolic SAR (Parabolic SAR)
The Parabolic SAR is a technical indicator that visually indicates the direction of the trend and reversal points.
A series of “dots” appear above and below the candlesticks, signaling trend reversals early.
■ How to Read It
・When thedots are below the candles →uptrend
・When thedots are above the candles →downtrend
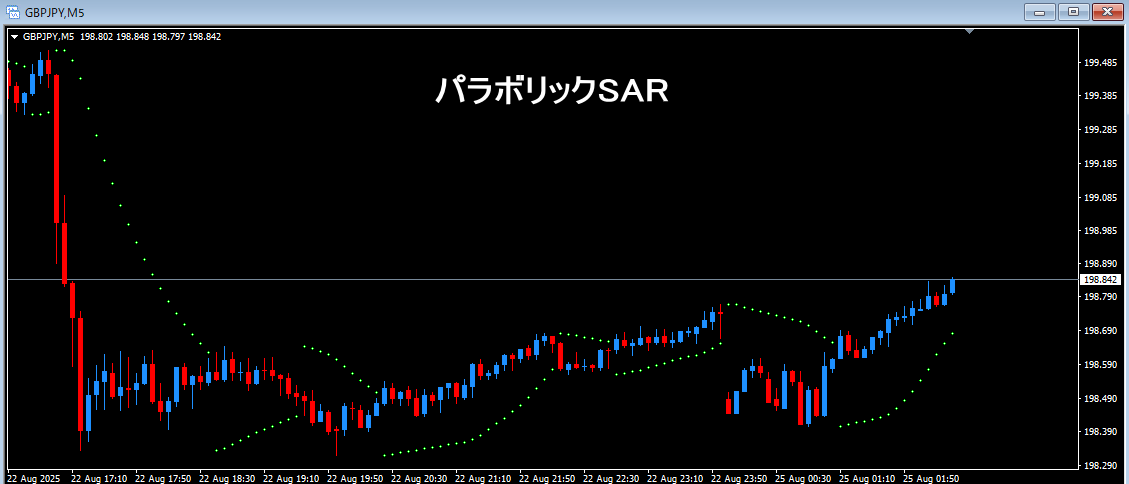
(Image: Candlesticks with Parabolic SAR dots)
■ Concept of Buy/Sell Signals
- Dotsswitch from below the candle to above→ Sell signal
- Dotsswitch from above the candle to below→ Buy signal
Suitable for trend-following long positions.
■ Strengths
- Visually easy to understand and beginner-friendly
- Trend-following type and strong for long-position trading
- Can be used as a guideline for exit timing (take profits / stop losses)
■ Weaknesses
- Many false signals in ranging markets
- During rapid market changes, signals switch frequently
■ Tips for Use
・Combine with trend indicators such as moving averages or MACD for effective use.
・If you combine with the ZoneBreaker Core environment recognition zone, you can narrow down the entry points with“zone direction + SAR signal”.
【In practice】 All indicators, rules, and theories are
“trust and wait for the moment”— this is the ultimate rule.
※ Parabolic SAR is strong in trends but requires caution in range-bound markets.
Always use in combination with other indicators.