

【Beginner】Technical Course|Envelope (Envelope)
【Practical】 All indicators, laws, and theories
"Believe and wait for the moment" is the absolute rule.
Technical Course | Envelope
Envelope is a band drawn above and below the moving average at a fixed deviation rate.It is a band drawn up and down at a fixed deviation rate from the moving average.
Visually determine how far away it is from the moving average, making it effective for counter-trend strategies and range-bound markets.
How Envelope Works
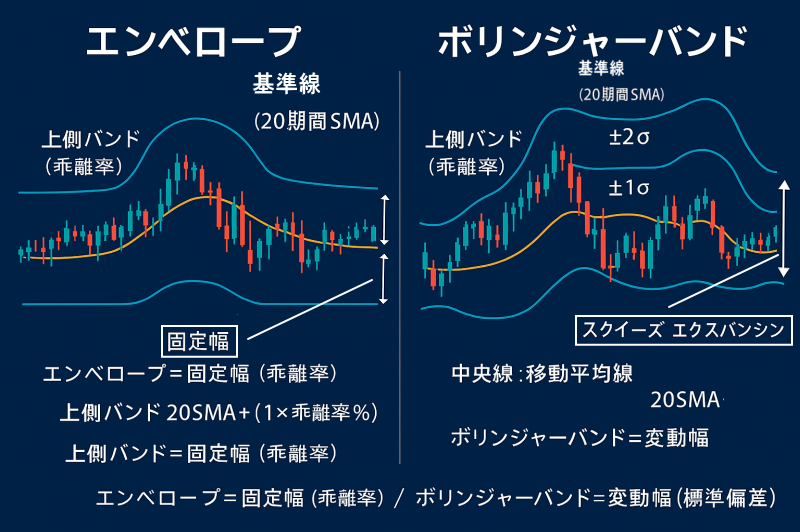
- Central line:Moving average (commonly a 20-period SMA)
- Upper band:Moving average × (deviation %)
- Lower band:Moving average × (deviation %)
For example, if the deviation is set to ±1%, lines are drawn 1% above and below the moving average.
Difference from Bollinger Bands
- Envelope:From the moving average,draws bands at a fixed deviation, always displaying a fixed width
- Bollinger Bands:From the moving average,based on standard deviation (price volatility), bands widen/narrow with market volatility
In simple terms, Envelope hasa fixed width, while Bollinger Bands havean automatically adjusting width.
Practical Usage
- Price touches the upper band →overbought → consider selling
- Price touches the lower band →oversold → consider buying
- In a strong trending market, a breakout may occur and the bands can go into a band-walking state, so be cautious
Tip:Envelope is strong forrange-bound reversal, while Bollinger Bandsare strong at capturing the start of trends.
Checklist
- Set deviation in line with market volatility (generally about 0.5%–2%)
- Determine in advance whether the market is ranging
- Using other indicators (RSI, Stochastic, support/resistance) increases accuracy
Envelope is a simple tool to gauge “excess heat” from the moving average.
Used together with Bollinger Bands, you can build trading strategies that apply to both ranges and trends.