
[Beginner] Technical Course | Bollinger Bands (Bollinger Bands)
In practice, all indicators, rules, and theories are
“believe and wait for the moment”the absolute rule.
Technical Course | Bollinger Bands
Bollinger Bandsis an indicator that visualizes price volatility by combining moving averages and standard deviations.
It can confirm market “overextensions” and “contractions,” and is used for both trend-following and counter-trend strategies.
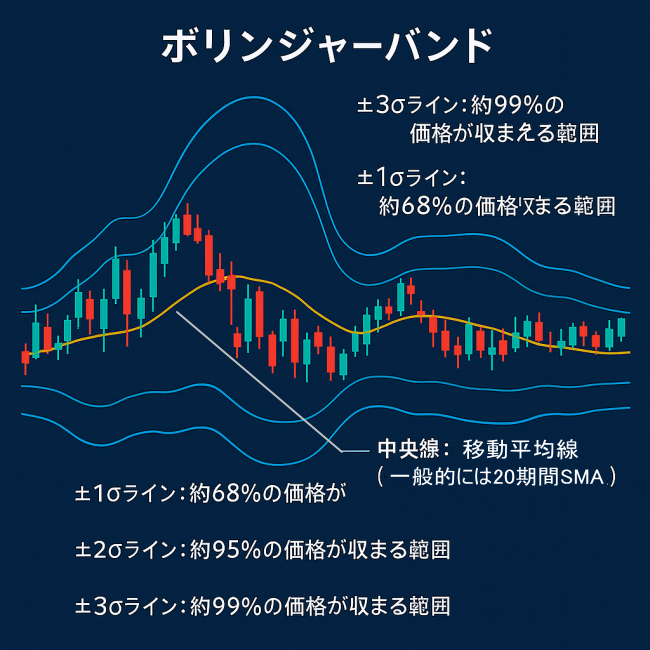
Basic components of Bollinger Bands
- Central line:Moving average (commonly a 20-period SMA)
- ±1σ line:Range that contains about 68% of prices
- ±2σ line:Range that contains about 95% of prices
- ±3σ line:Range that contains about 99% of prices
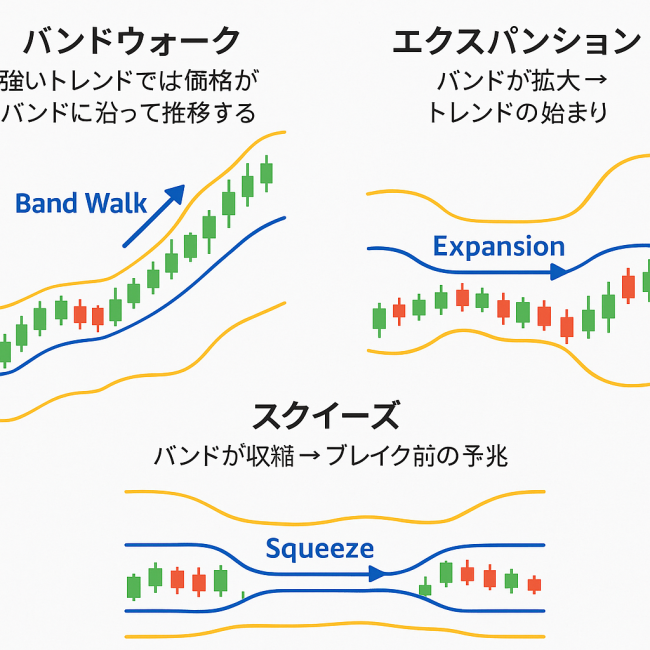
Basic usage
- Band walk:In strong trends, prices move along the bands
- Expansion:Bands widen → start of a trend
- Squeeze:Bands contract → prelude to a breakout
- Counter-trend:Target rebound when ±2σ or ±3σ is reached (effective in ranging markets)
Important:Bollinger Bands are not a “line where price must return,” but a
leading signal reflecting market momentum (volatility).
Practical ways to use them
- Look for squeezes → energy accumulation before a trend emerges
- Go with the breakout direction → enter when expansion occurs
- In ranging markets, use counter-trend → aim for rebounds near ±2σ or ±3σ
In particular, “expansion after a squeeze” is a signal that many traders watch.
Use Bollinger Bands in combination with moving averages and support/resistance to improve accuracy.
Checklist
- Is the band width narrow or wide? (squeeze or expansion)
- Is the price above or below the central line (moving average)?
- When a trend forms, is the price riding the Band Walk?
- If taking a counter-trend position, always confirm that the market is range-bound
Bollinger Bands are a versatile tool that can handle both “trend” and “range.”.
However, proper usage is key. In trending markets, focus on trend-following; in ranging markets, focus on counter-trend strategies.