
[Beginner] Technical Course | Support & Resistance
【In practice】 All indicators, rules, and theories are
“believe and wait for the moment”the absolute rule.
Technical Course | Support & Resistance
(Basics to Know)
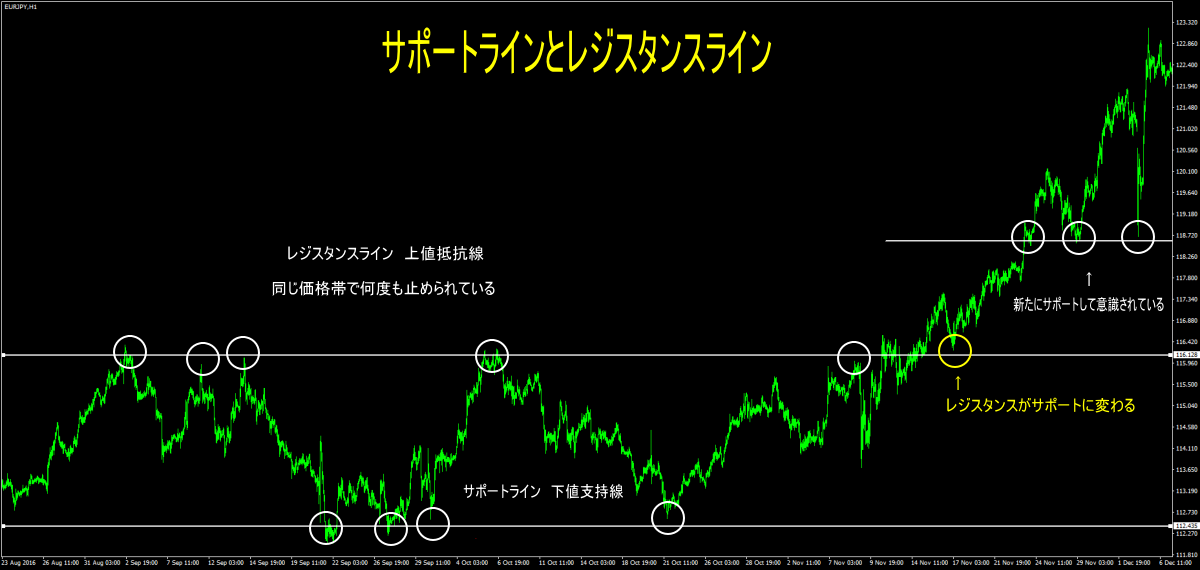
Visualizing price zones where the market tends to stop or reverse isResistance (upper price limit)andSupport (lower price floor)zones.
- Resistance Line: A zone where the price has repeatedlybeen halted at the upper level
- Support Line: A zone where the price has repeatedlybeen halted at the lower level
How to draw lines (concept)
In FX blogs, there are various methods like drawing at wicks or at bodies,either is fine. (The same goes for trendlines.)
- Prices are more often watched in bands (zones) rather than pinpoint points“bands (zones)”.
- Prioritize drawing where wicks and bodies overlap most(don’t overcomplicate it).
- In multi-time-frame analysis, start bydrawing lines on higher time frames (daily, 4H)as the base.
Important:
If price breaks above resistance, that line (zone) becomes a support to watch
If price breaks below support, that line (zone) becomes a resistance to watch
Breaking the line is not the end; you must confirm“Support-Resistance to Support/Resistance flip (break → retest)”is functioning.
If price breaks above resistance, that line (zone) becomes a support to watch
If price breaks below support, that line (zone) becomes a resistance to watch
Breaking the line is not the end; you must confirm“Support-Resistance to Support/Resistance flip (break → retest)”is functioning.
Practical steps (3 steps)
- Identify major zones on higher time frames: Extract the band where highs and lows overlap on timeframes above the execution time frame
- Determine zone width: Mark the consolidation range of wicks/bodies as a band
- Time the lower time frame: Execute when there are signals of rebound/break on the execution timeframe (candle close, MA slope, etc.)
Common mistakes and how to avoid
- Thinking in a single thin line →Treat as a band (zone)
- Jumping in right after the first break →Prioritize retest (support-resistance flip) confirmation
- Judging with only a lower time frame →Value higher-timeframe zones overlap (confluence)
Checklist
- Has the price reached thehigher-timeframe zone?
- Is there a reaction at the zone (long wicks, patterns)?
- On break, can you wait for a retest → rebound??
- Does it align with other indicators (MA slope, pivots, volume indicators, time zones)?
Video
※ The line is not treated as an absolute value;treat it as a zone. The band that has repeatedly halted the price tends to be more effective.
× ![]()