

【BTCJPY】20190124 Daily Pivot
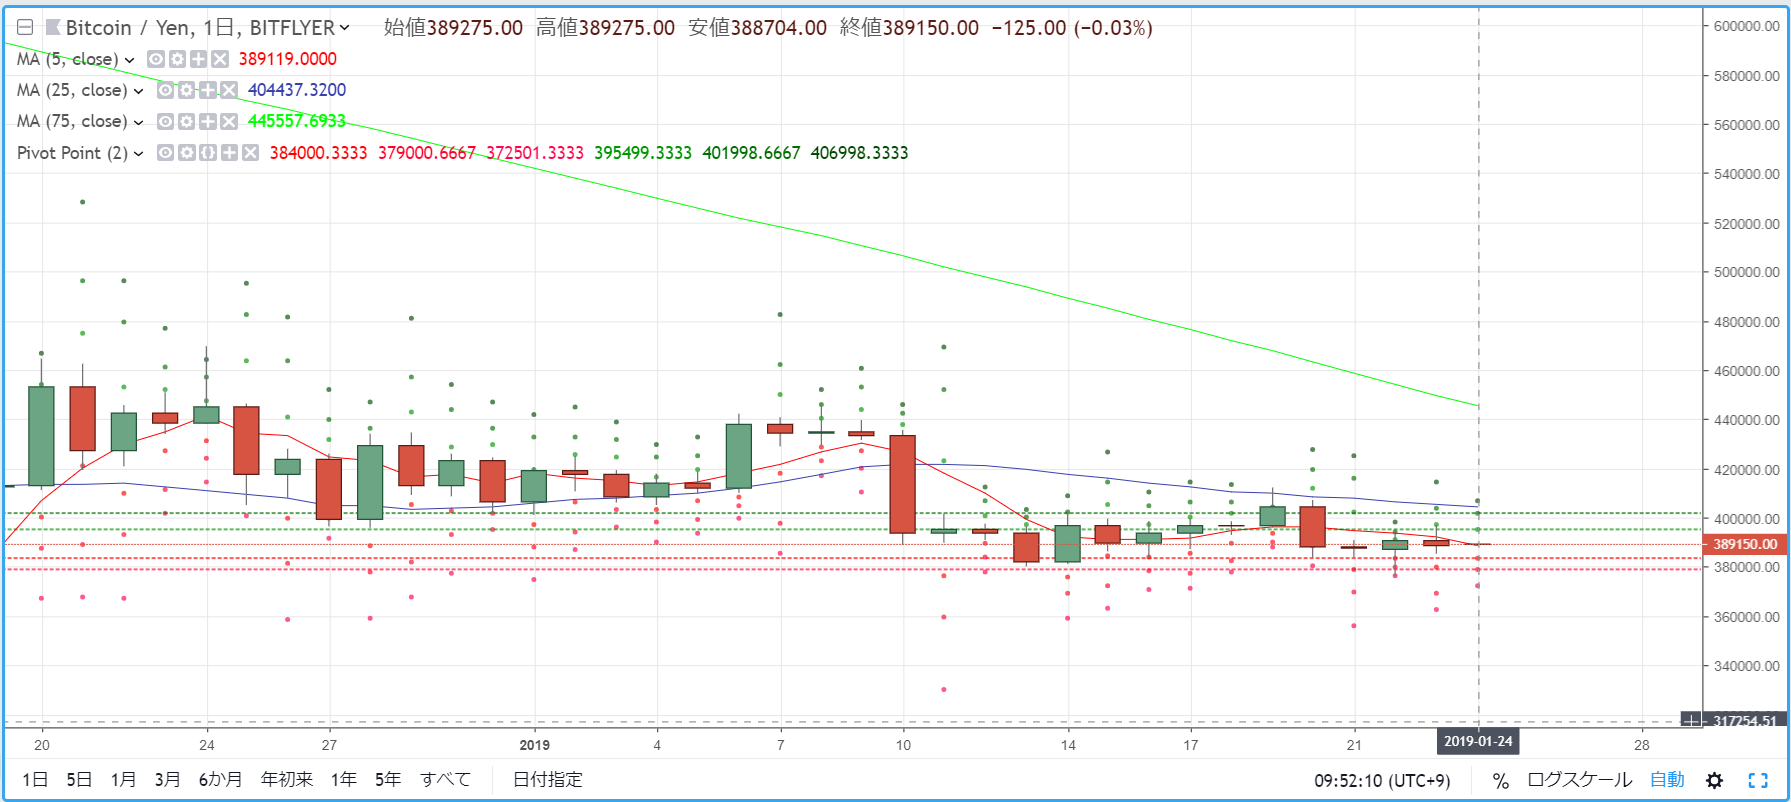
R2=401,998
R1=395,499
S1=384,000
S2=379,000
※ Pivot points are a technical indicator used to estimate the day's price movement from the previous day's price action. Centered on the Pivot Point (PP), lines for resistance (R1, R2) and support (S1, S2) are drawn above and below, and are used as trading references.
【Calculation formulas】
Pivot Point (PP) = (Previous day's close + previous high + previous low) / 3
Resistance Line 1 (R1) = PP + (PP - previous low)
Support Line 1 (S1) = PP - (previous high - PP)
Resistance Line 2 (R2) = PP + (previous high - previous low)
Support Line 2 (S2) = PP - (previous high - previous low)


