

【BTCJPY】20190118 Daily Pivot
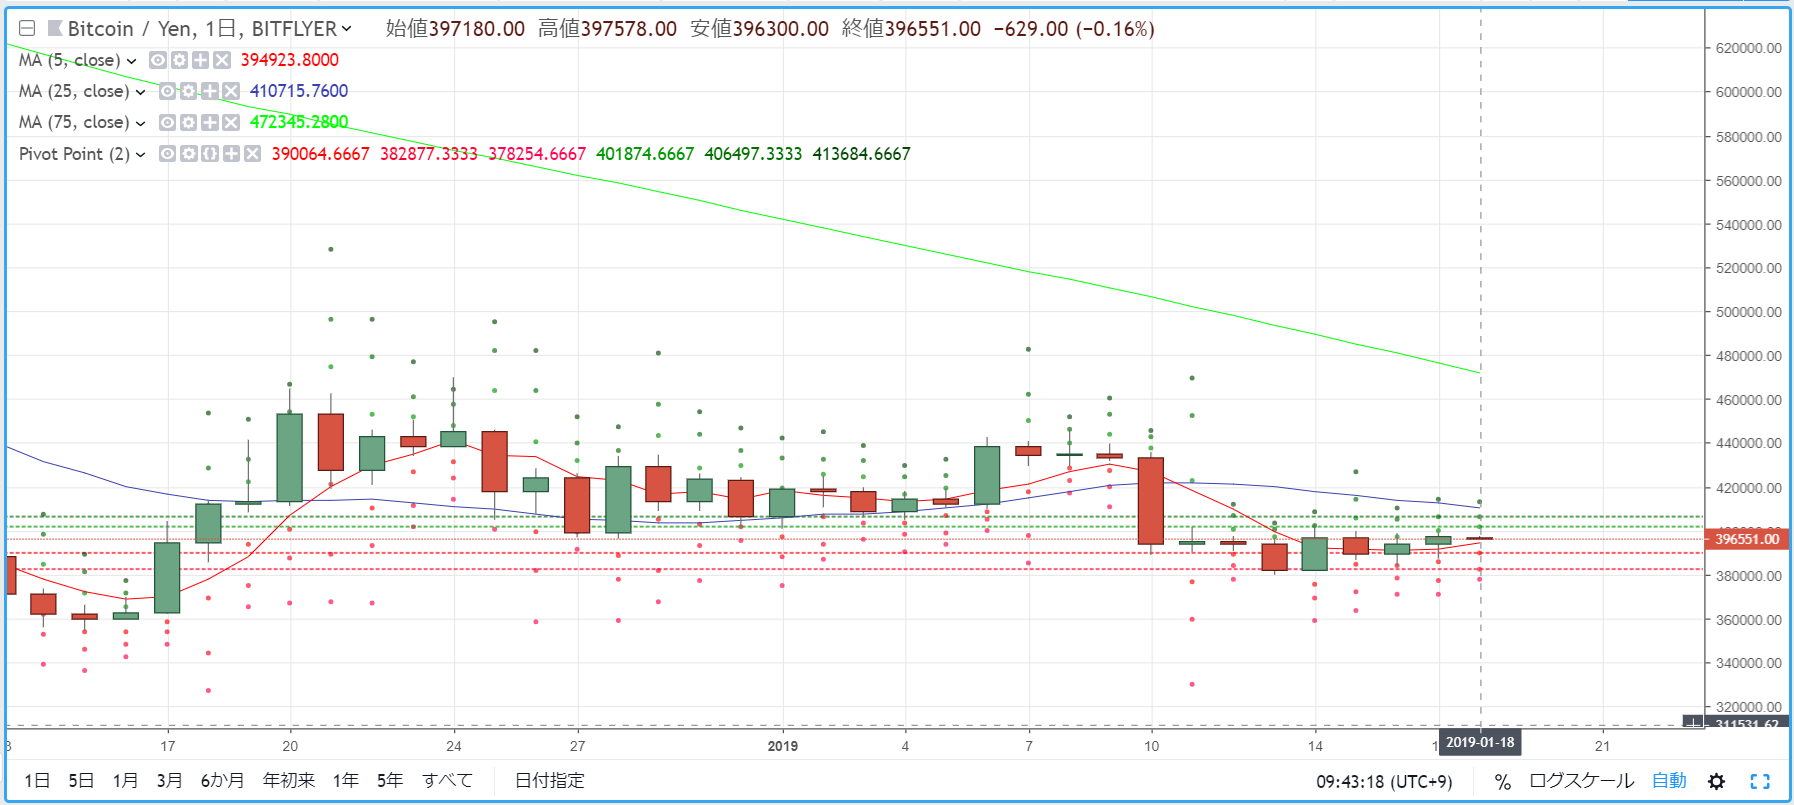
R2=406,497
R1=401,874
S1=390,064
S2=382,877
※ A pivot is a technical indicator that predicts today's price movement based on yesterday's price action. Centered on the Pivot Point (PP), draw resistance lines (R1, R2) and support lines (S1, S2) above and below, and use them as trading references.
【Calculation】
Pivot Point (PP) = (Yesterday's close + Yesterday's high + Yesterday's low) / 3
Resistance Line 1 (R1) = PP + (PP - Yesterday's low)
Support Line 1 (S1) = PP - (Yesterday's high - PP)
Resistance Line 2 (R2) = PP + (Yesterday's high - Yesterday's low)
Support Line 2 (S2) = PP - (Yesterday's high - Yesterday's low)


