The Way of Investment (Episode 194) - Market Analysis Section -
The Way of Investment (that194)
<Market Analysis Chapter>
1. 2025first halfUSDJPYmarket analysis
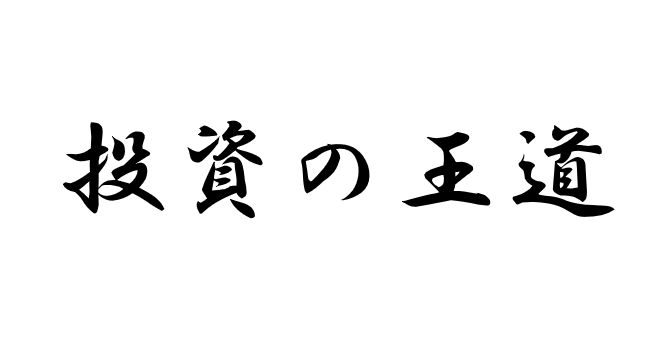
USDJPYdaily chart analysisyear2025monthindicates a trend reversal from an uptrend to a downtrend.
The figure above is theUSDJPYdaily chart. In hindsight,1monthUSDJPYcould have a selling position opened and closed in4months, resulting in easily about 1600 pips of profit.
2.USDJPYDaily Chart Detailed Analysis
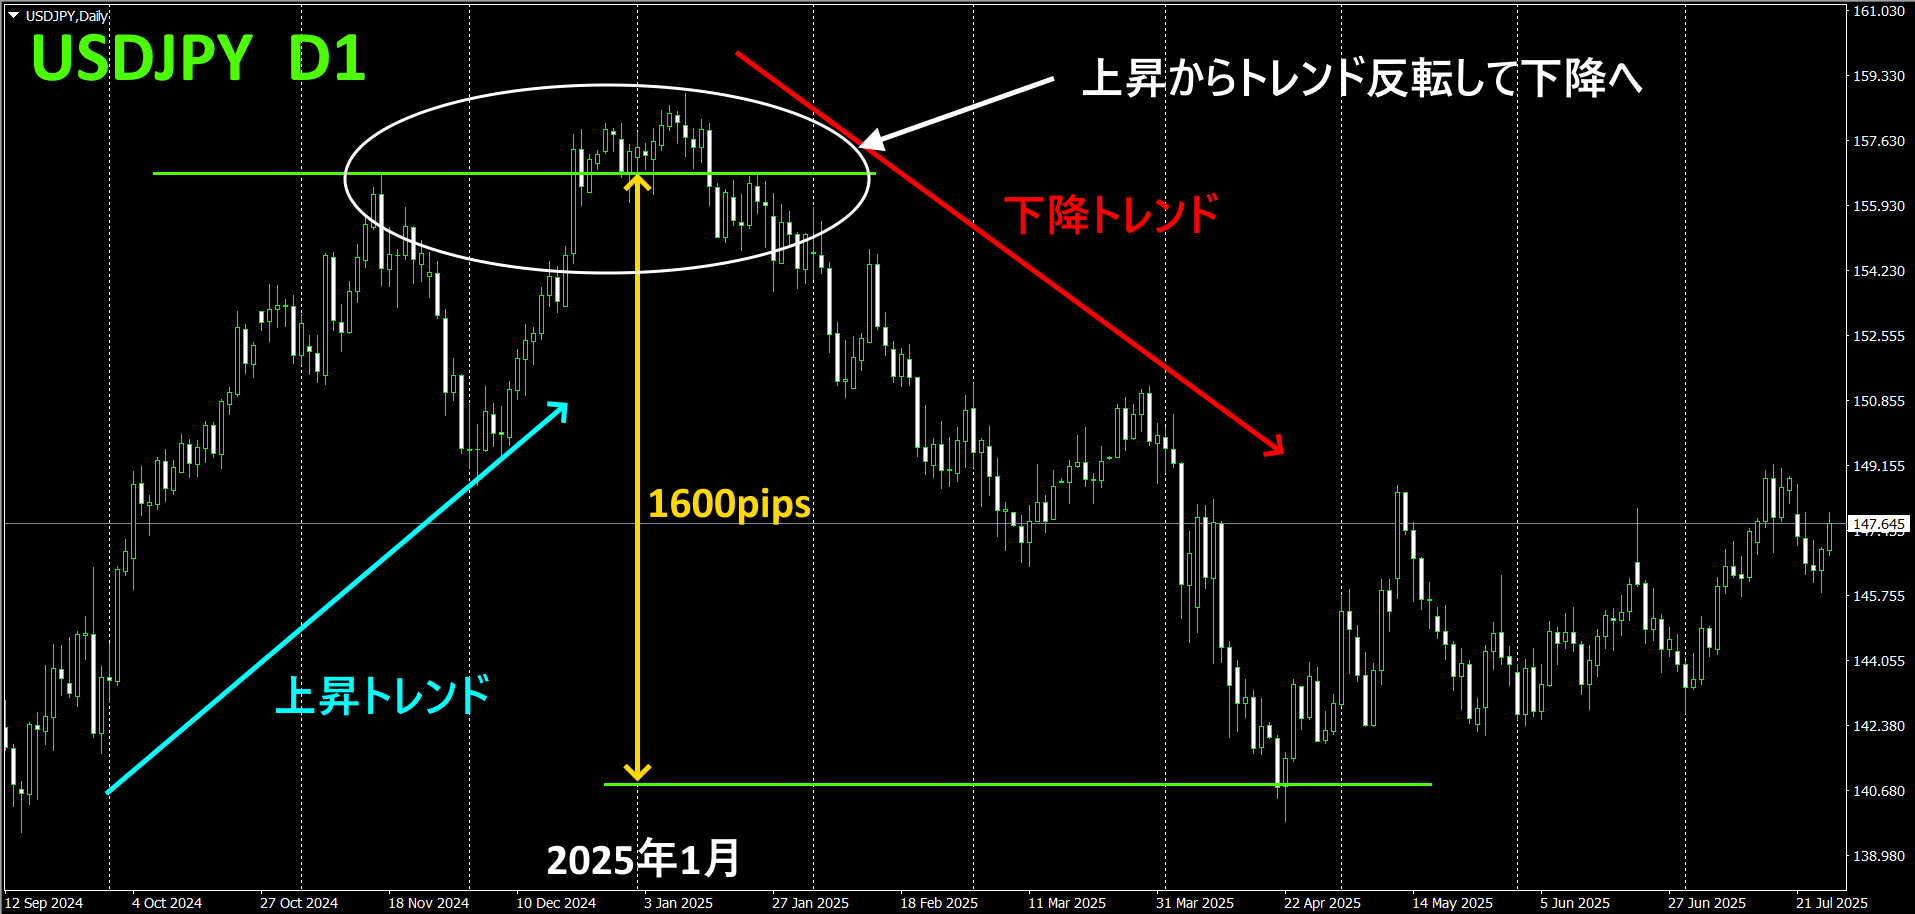
We inserted a “Currency Strength Visualizing Indicator” into the daily chart.
The upper half is theUSDJPYdaily candlestick chart, and the lower half is from the currency strength indicator.
1/10Daily high
1/14Currency strength graph difference reaches maximum (USD – JPY)
1/15Candles break below the moving averageEMA20
1/20Currency strength graph breaks below that moving average
1/22Candle pullback (aboveEMA20)
1/23SecondEMA20break
According to Dow Theory, “A trend continues until a clear reversal signal occurs,” so uptrend is considered continuing until 1/23 when a new high could not be made.
Meanwhile, in the currency strength indicator, since it focuses on currency strength difference, when the currency strength difference reaches its maximum and falls below its moving average, a “sell” decision can be made. When the currency strength graph falls below that moving average, a red downward arrow appears, and you can follow this arrow to enter a “sell” trade.
The above is a daily-based assessment.
3. On the 1-hour chartUSDJPYchart movement
Now, to be more precise, we will examine theUSDJPY1-hour chart to observe the progression after the peak was reached.

If you’re looking for a selling entry on the 1-hour chart, the clear level is the break of the recent low on 1/15.1/15The price has not updated to a new high on the 1-hour chart, and the moving averages (EMA20 andEMA200) have given a death cross, so the selling condition is met.
Even if you did not open a sell position here, a double top neckline break will appear, so you may initiate a sell from there. Of course, the rate may revert, but drawing a horizontal line at the recent low acts as a support-resistance line, so placing your stop slightly above this line is reassuring.
<Conclusion>