The Noble Path of Investing (Part 112)
The King of Investing (Part112)
Daily Chart Trading Practical Edition
1.
NZDCHF Daily Chart
The King of Investing (Part109) where I chose to “buy NZDCHF.” The figure below is theNZDCHF daily chart.
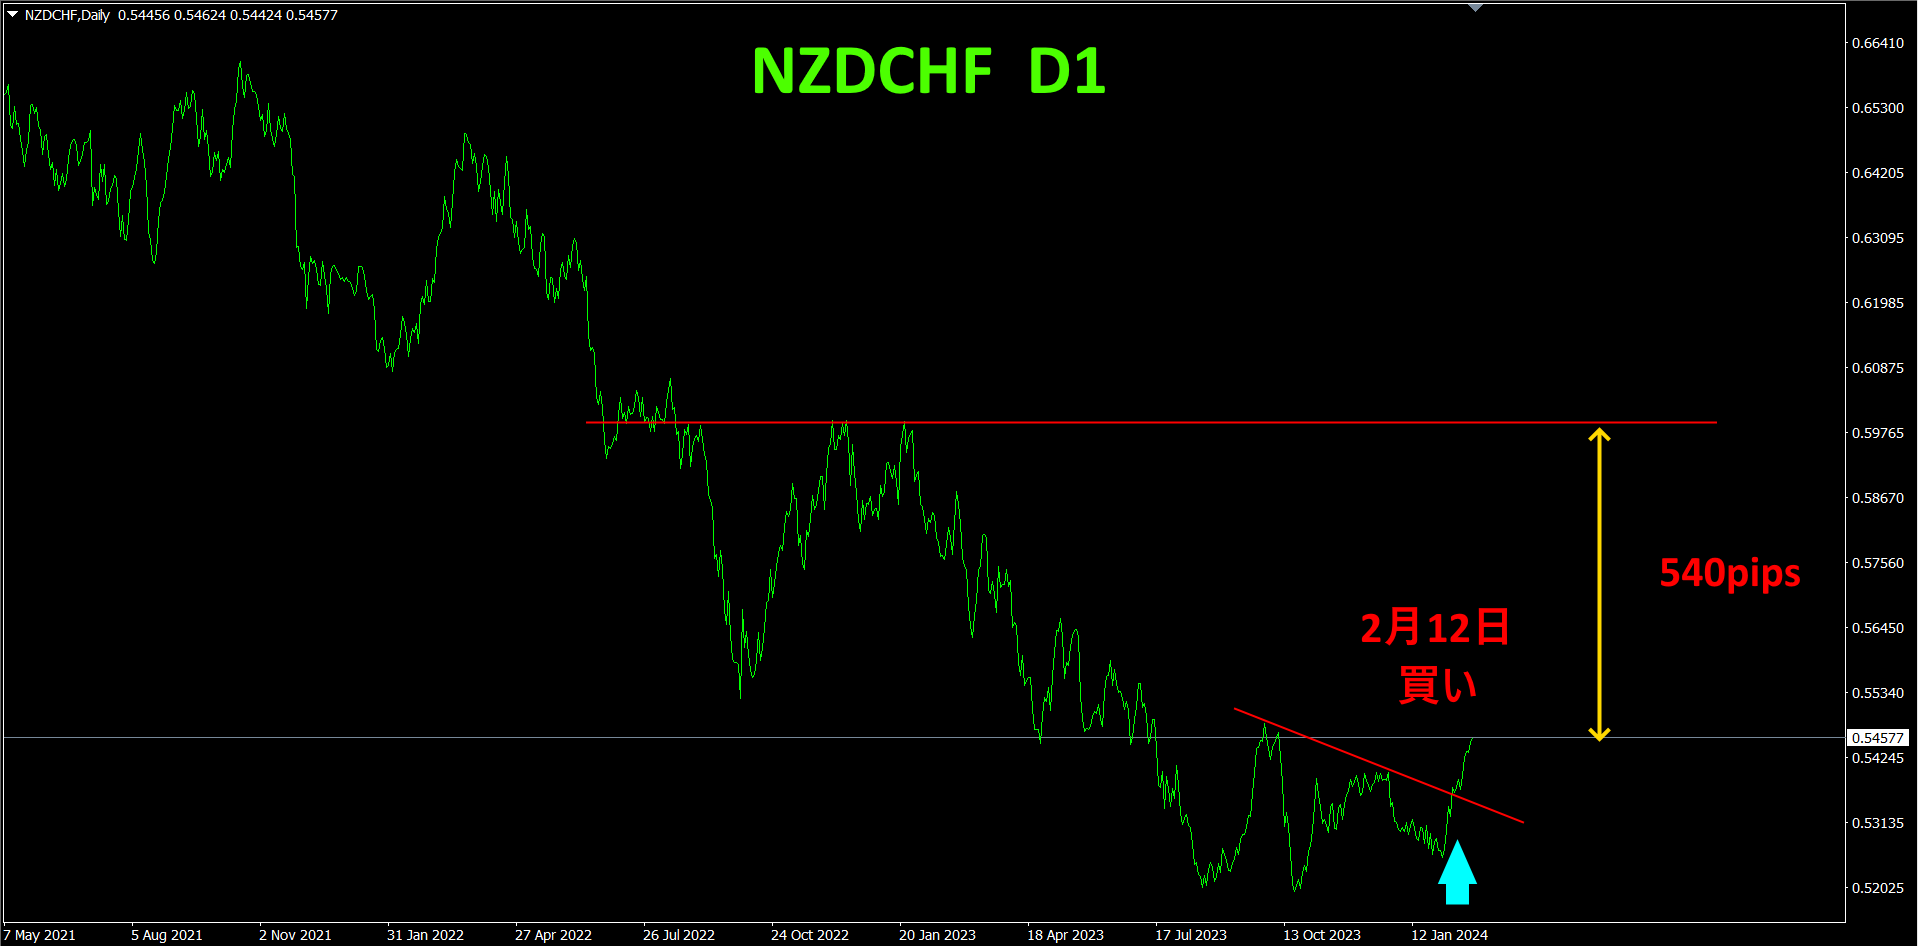
On 2024 year2 month12 day, I broke above the trendline and entered a buy. Currently, it is about90pips in unrealized gains. The entry point was at the right shoulder of an inverse head-and-shoulders, after the daily chart formed a major bottom, making an“ideal buy entry”.
Up to the most recent high, there is a spread of about540pips, so if things go well, an interval of about500pips profit is expected. The strength of the daily chart as a “kingly trade” is the ability to hold a long position with confidence.