

【BTCJPY】20190116 Daily Pivot
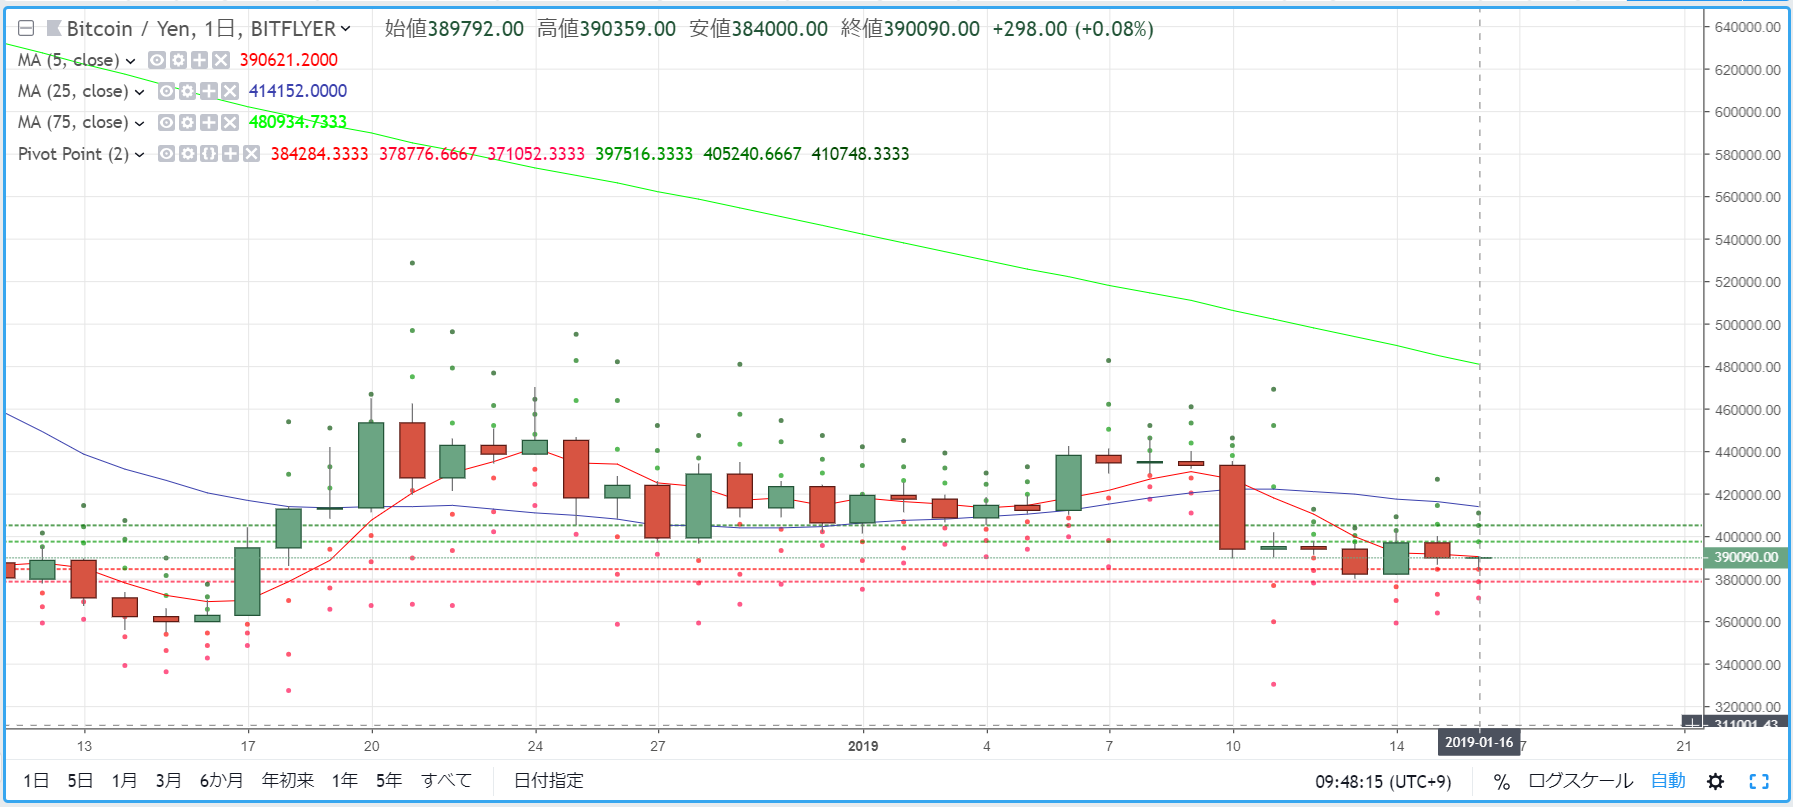
R2=405,240
R1=397,516
S1=384,284
S2=378,776
※ A pivot point is a technical indicator that estimates the day's price movement based on the previous day's activity. Centered on the Pivot Point (PP), resistance lines (R1, R2) and support lines (S1, S2) are drawn above and below, and these are used as trading guides.
【Calculation formulas】
Pivot Point (PP) = (Previous day's close + previous day's high + previous day's low) / 3
Resistance Line 1 (R1) = PP + (PP - previous day's low)
Support Line 1 (S1) = PP - (previous day's high - PP)
Resistance Line 2 (R2) = PP + (previous day's high - previous day's low)
Support Line 2 (S2) = PP - (previous day's high - previous day's low)


