

【BTCJPY】20190111 Daily Pivot
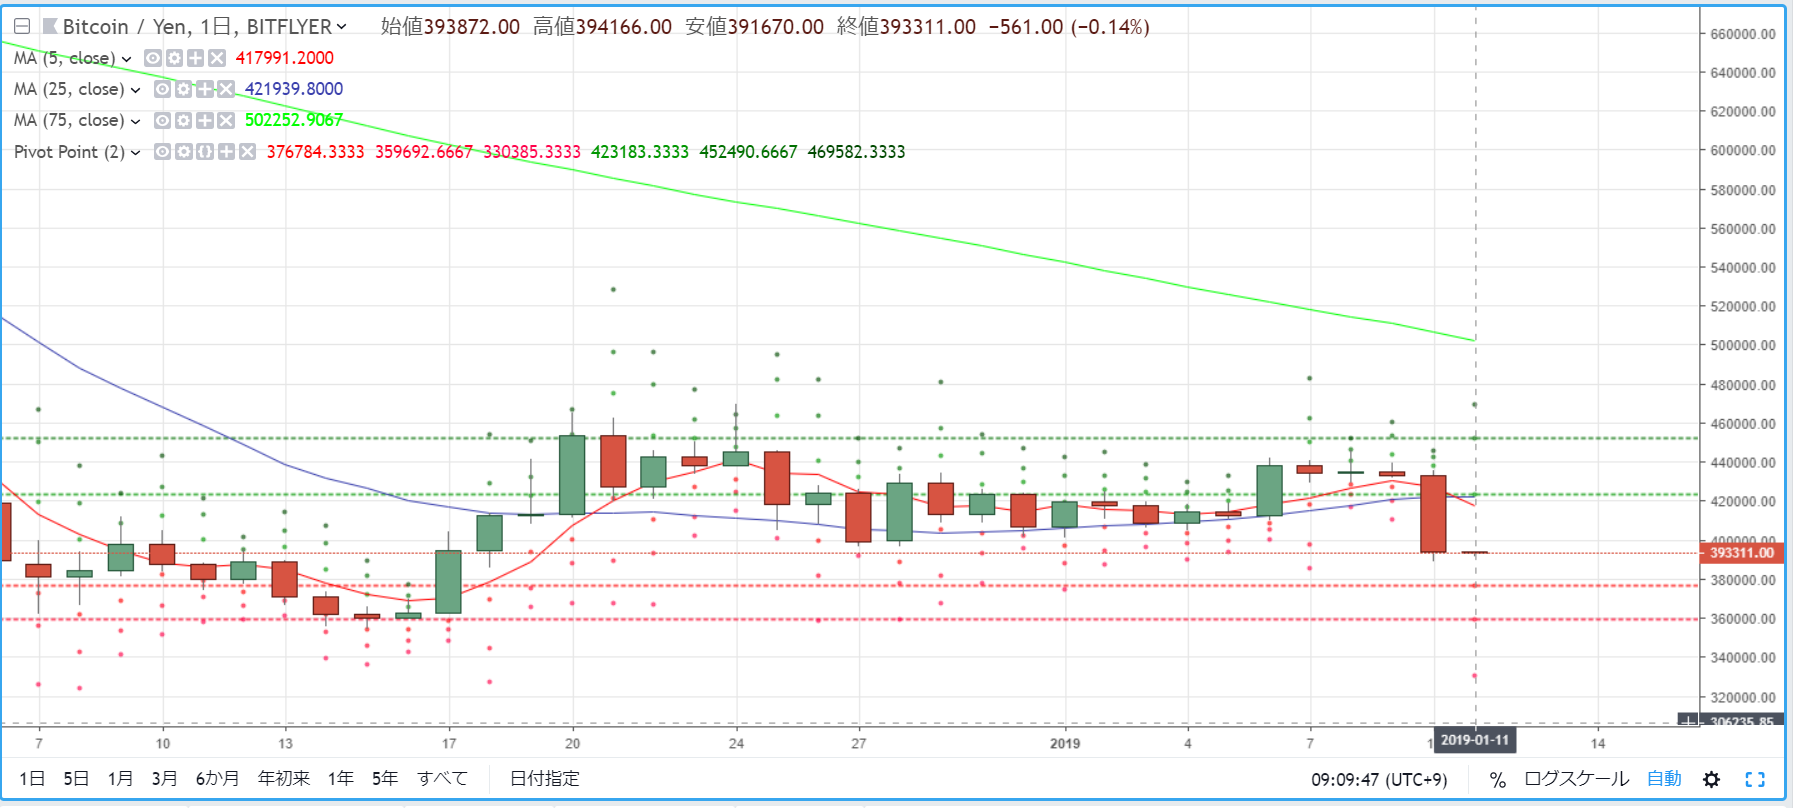
R2=452,490
R1=423,183
S1=376,784
S2=359,692
※ A pivot is a technical indicator that predicts the price movement for the day based on the previous day's price action. Centered on the Pivot Point (PP), draw the resistance lines (R1, R2) above and the support lines (S1, S2) below, and use them as trading references.
【Calculation Formula】
Pivot Point (PP) = (Previous day's close + high + low) / 3
Resistance Line 1 (R1) = PP + (PP - Previous day's low)
Support Line 1 (S1) = PP - (Previous day's high - PP)
Resistance Line 2 (R2) = PP + (Previous day's high - Previous day's low)
Support Line 2 (S2) = PP - (Previous day's high - Previous day's low)
(Replace this section when publishing to purchasers)


