

【BTCJPY】20190110 Daily Pivot
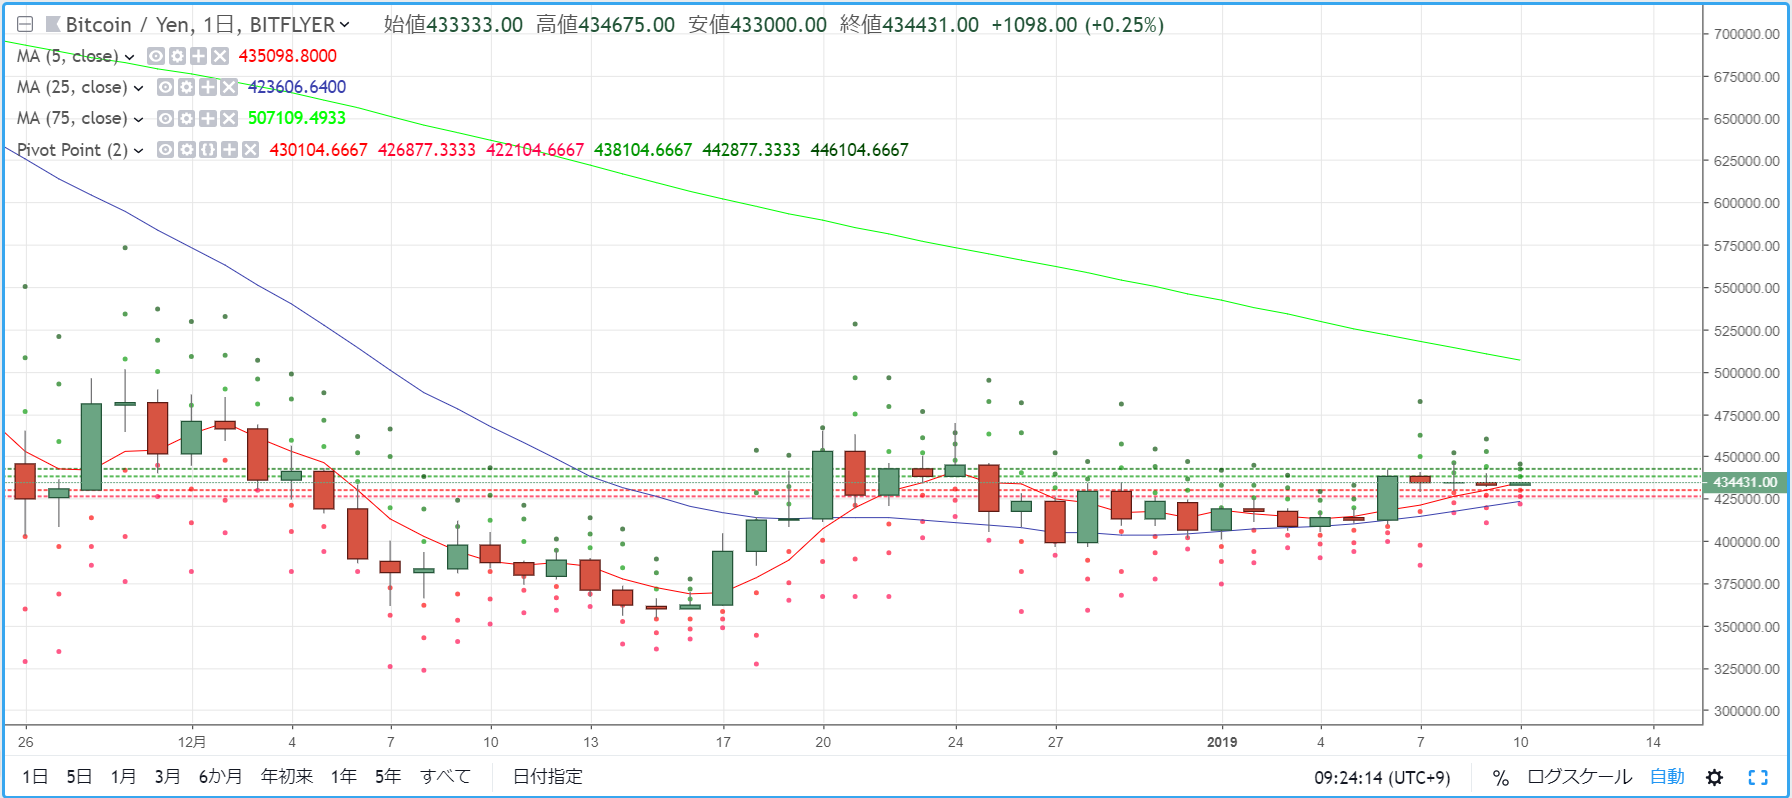
R2=442,877
R1=438,104
S1=430,104
S2=426,877
※ Pivot points are a technical indicator that predicts the day's price movement based on the previous day's movement. Centered on the Pivot Point (PP), draw resistance lines (R1, R2) and support lines (S1, S2) above and below, and use them as trading references.
【Calculation formula】
Pivot Point (PP) = (Previous day's close + high + low) / 3
Resistance Line 1 (R1) = PP + (PP - previous day's low)
Support Line 1 (S1) = PP - (previous day's high - PP)
Resistance Line 2 (R2) = PP + (previous day's high - previous day's low)
Support Line 2 (S2) = PP - (previous day's high - previous day's low)


