

【BTCJPY】20190109 Daily Pivot
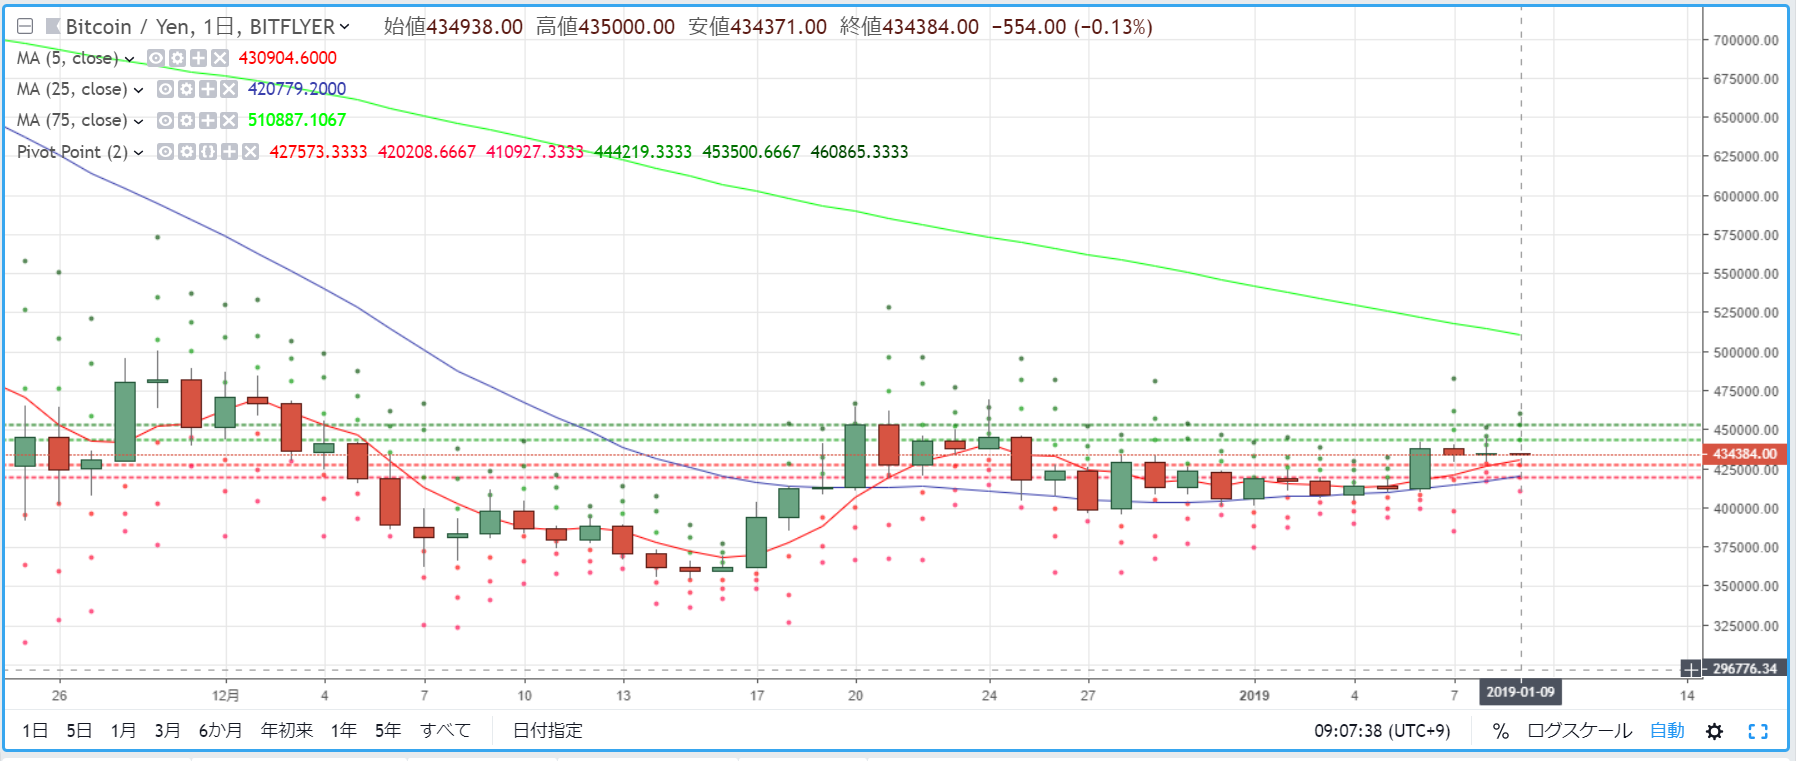
R2=453,500
R1=444,219
S1=427,573
S2=420,208
※A pivot point is a technical indicator that predicts the price movement for the current day based on the previous day’s price range. Centered on the Pivot Point (PP), draw resistance lines (R1, R2) above and below, and support lines (S1, S2) to use as trading references.
【Calculations】
Pivot Point (PP) = (Previous day's close + previous day's high + previous day's low) / 3
Resistance Line 1 (R1) = PP + (PP - previous day's low)
Support Line 1 (S1) = PP - (previous day's high - PP)
Resistance Line 2 (R2) = PP + (previous day's high - previous day's low)
Support Line 2 (S2) = PP - (previous day's high - previous day's low)
(Please replace this part when sharing with buyers)


