

【BTCJPY】20181226 Daily Pivot
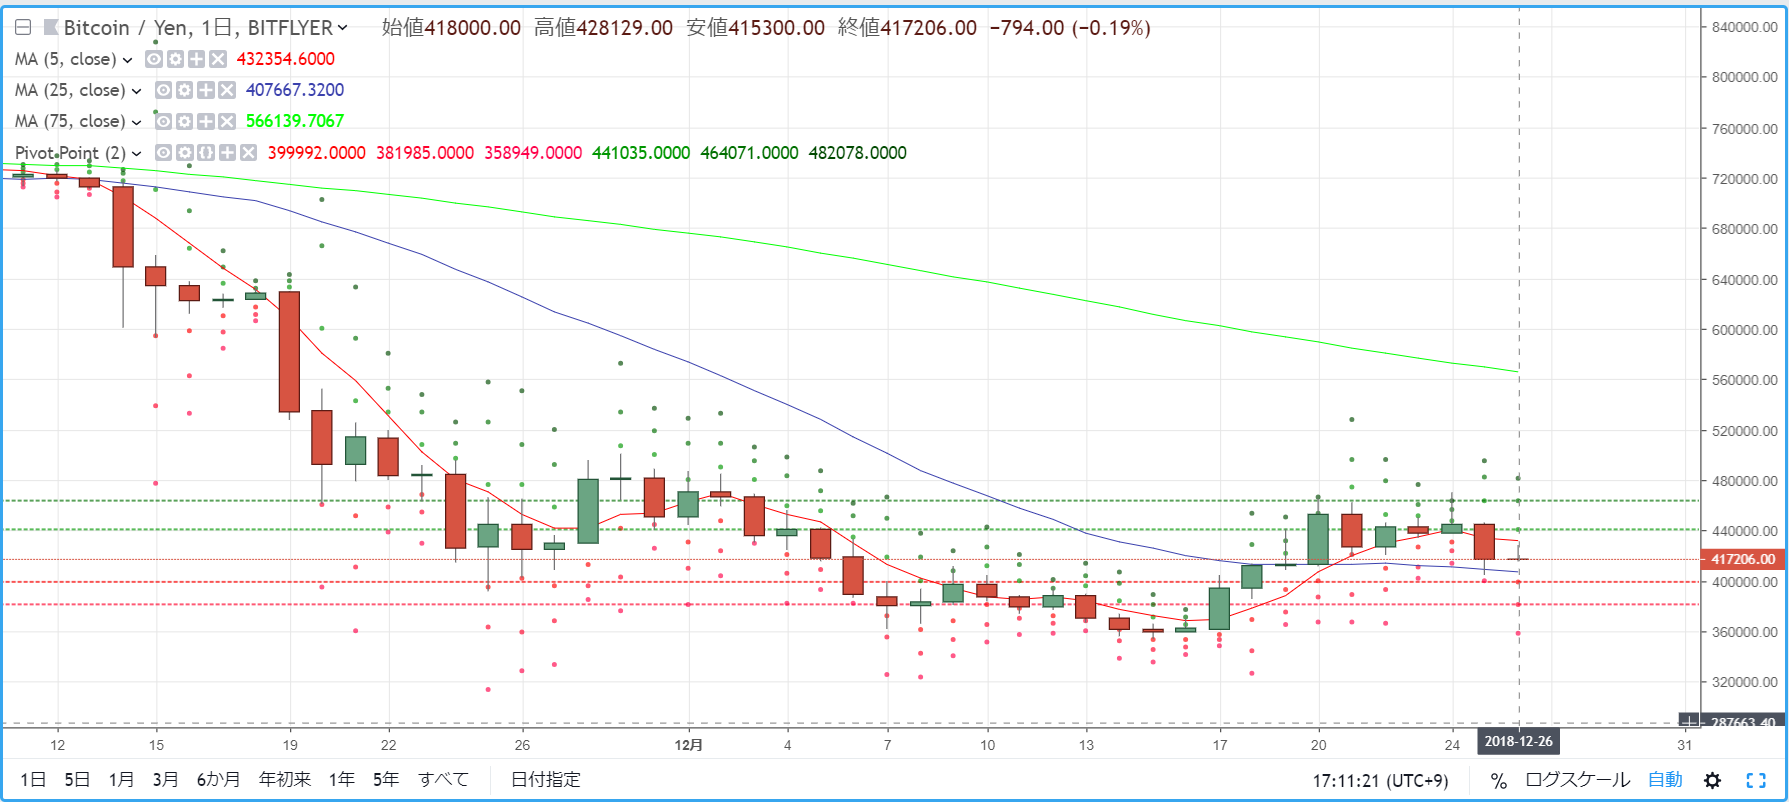
R2=464,071
R1=441,035
S1=399,992
S2=381,985
※ A pivot is a technical indicator that estimates today’s price movement from yesterday’s price action. Centered on the Pivot Point (PP), draw resistance lines (R1, R2) above and below, and support lines (S1, S2) below, using them as trading guidelines.
【Calculation formulas】
Pivot Point (PP) = (Yesterday's Close + Yesterday's High + Yesterday's Low) / 3
Resistance Line 1 (R1) = PP + (PP - Yesterday's Low)
Support Line 1 (S1) = PP - (Yesterday's High - PP)
Resistance Line 2 (R2) = PP + (Yesterday's High - Yesterday's Low)
Support Line 2 (S2) = PP - (Yesterday's High - Yesterday's Low)


