

BigBangProfitSignalEA Original & Type-R Portfolio Analysis
------------------------------------------------
Empathy 99.9%!
What is the FX manga that’s all the talk today??
↓
------------------------------------------------
※ This article is a high-volume report-level piece.
Please take your time and read it slowly.
◆Introduction◆
BBP E Ace? BigBangProfitFXBundle!! includes two Euro-Yen portfolio EAs.
- BBPEA EURJPY Original
- BBPEA EURJPY Type-R
these are the two.
As for the fundamental performance, we discuss backtest analyses in the article below.
“BigBangProfitSignalEA Original & Type-R Backtest Analysis”
https://ryusei-fx.biz/bigbangprofitsignalea-original-type-r-back-test
In this article, we mainly explain the status of each EA, so those considering BBPEA should read in detail.
This time, we will discuss from the portfolio perspective for
- BBPEA EURJPY Original
- BBPEA EURJPY Type-R
which wasn’t covered in detail in the above analysis article. This is for users, but I think those considering BBP will also find it interesting ^^
◆ About the credibility of BBPEA’s backtest ◆
In the following article, I mention the lack of credibility of backtests.
“Out-of-sample testing, walk-forward testing reveal EA superiority not visible in backtests”
”
https://ryusei-fx.biz/out-of-sample-test_walk-foward-test
Indeed, backtests alone do not reveal an EA’s edge.
HoweverBBPEA passes rigorous reproducibility tests such as out-of-sample tests and walk-forward tests—that is a fact.
If a strategy passes strict reproducibility tests, the credibility of its backtest is high.
In this verification as well, we evaluate the strategy’s performance with backtests, but since it has passed strict reproducibility tests, there is no issue in credibility.
And,BBPEA has very few buy/sell conditions, so there is little difference between backtest and real trades as well.
That also supports the credibility of backtests.
This analysis will show BBPEA’s practical performance, so please rest assured.
◆ BBPEA EURJPY Original Profit & Loss (Early 2005 – December 18, 2018) ◆
Now, let’s look at BBPEA EURJPY Original.
The period runs from early 2005 to December 18, 2018.
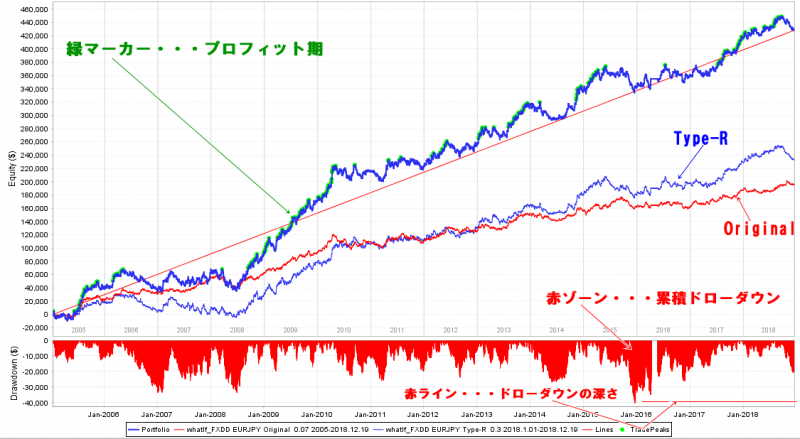
■ Profit Curve
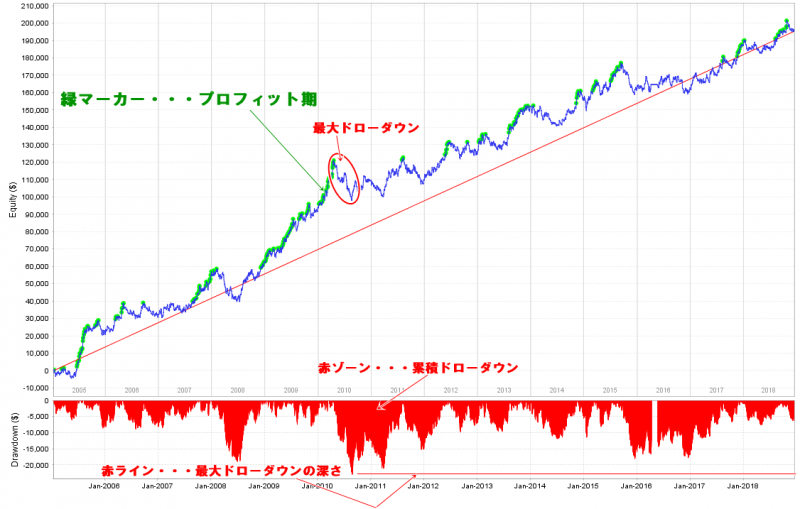
It’s a healthy equity curve that climbs with profits despite occasional wins and losses^^
What we focus on here are
- Profit phase (green markers)
- Cumulative drawdown (red zone)
- Maximum drawdown line (red line)
three aspects.
■ Profit phase (green markers)
The green-marker profit phase indicates the period from the previous peak in profits to the point where the drawdown begins after reaching new highs.
“Trading focuses on risk.”
It is said,but I think you must also focus on profitsas well.
The text notesthat the profit-phase zones are not appearing very frequentlyso keep that in mind.
In other words,it is mostly flat or in drawdown, that’s the reality.
People often over-expect profits and fail to sustain the operation.
That is the “beginner” phenomenon you see, an “all-too-common”, so if you fit that stage, graduate from it quickly!
In 2016, although the yearly total was positive, profit phase was absent and it was a tough equity period.
Yet 2017 showed large gains as a rebound from 2016.
Thus,winter eventually ends and spring comes.
It would be a waste to end the operation without enjoying spring after lamenting the winter.That is the point.
“The profit phase doesn’t come easily…”
Before lamenting that, properly identify the profit phase in the above chart.
With a steady, patient approach, seize the profit phase when it arrives and
“win where you can win”
and stay confident.
■ Cumulative Drawdown (red zone) and Maximum Drawdown line (red line)
At the bottom of the chart,the red zone represents cumulative drawdown,the red line shows the depth of the maximum drawdown.
If you look at the three-year flow from 2009 to 2011,there is a drawdown rebound.It’s visible.
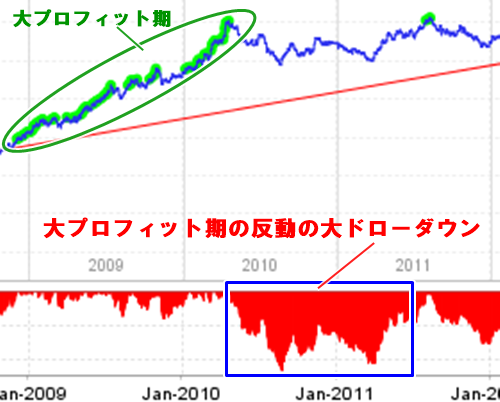
※ The graph’s aspect ratio may vary
As you can see above, the prior year with the highest drawdown also brought the highest profit.
This drawdown rebound is almost mystic!
However, this is also stated by systematic trading authorities as the essence of the strategy’s equity.
After an over-shoot in equity, it tends to revert to the mean.
Therefore, the drawdown period is a time of opportunity, and the profit-phase rebound can come any time.
Do not stop the EA just because it’s not performing well for a short period.
■ After BBPEA release, the maximum drawdown has not yet been updated

BBPEA was released in September 2015.
Looking at the red line (the depth of the maximum drawdown),since the EA’s release, the maximum drawdown of 2010–2011 has not been updated.
By the time I’m writing this article on December 19, 2018, there was a drawdown tendency since November.
Nevertheless,in terms of cumulative drawdown, there’s still plenty of depth left.
Drawdown is a trivial level.
If you fit this, examine the cumulative drawdown on the equity chart carefully.
You’ll see that the current drawdown isn’t that big.
■ Events right after the September 2015 release

Right after BBPEA was released in September 2015, a significant drawdown came.
This is a market perception after a product launch, butthe reality is something you must accept.
Still,the drawdown was within the maximum drawdown range.
“I faced a drawdown so large that the account couldn’t operate. If you have confidence in your tool, show numbers. The only good thing was I was using a demo account.”
As mentioned earlier, the drawdown at that time was within the range of the past maximum drawdown.
However, the critic who voiced concerns reportedly faced margin calls.
“What kind of money management are you doing?”
Because they spoke loudly but couldn’t even analyze the EA they used.
If you analyze backtest data withQuant Analyzer it clearly shows the cumulative drawdown in an easily understandable form.
Knowing the current equity situation is very important, too, so check the cumulative drawdown.
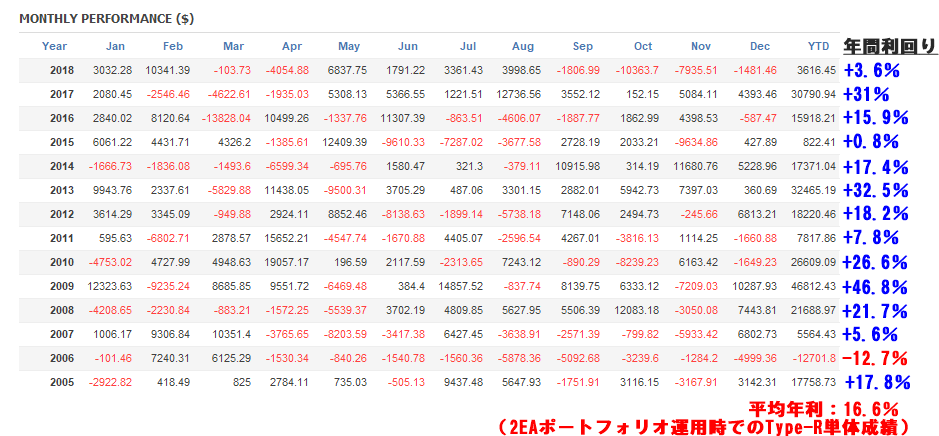
◆ Monthly and annual P/L table (monetary base) ◆
Let’s look at the BBPEA EURJPY Original monthly and annual performance.
In monetary terms.
With a $100,000 operating capital trading Original and Type-R,
“How much does Original alone make or lose?”
is shown in the P/L table.
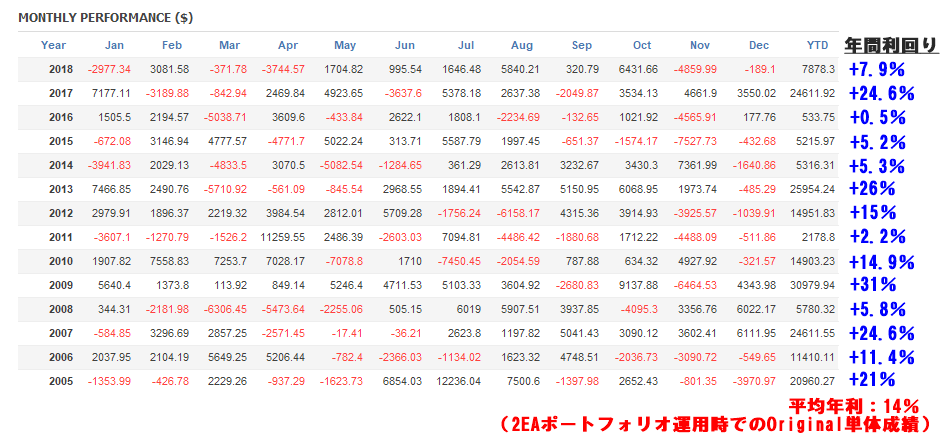
■ Annual yield

The original BBP, BBPEA EURJPY Original, has remarkable stability,annual P/L shows no losses.
Having the entire year in the black is satisfying to see (lol).
Performance varies by year, of course, butaverage annual return is 14%.
This is, assuming half of the funds are allocated to Type-R.
■ Focus on negative months in monthly breakdown

As for monthly P/L, there are quite a few negative months.
This is something we must accept.
“The holy grail of always-positive monthly P/L”“The sacred fever of always having a positive monthly P/L”doesn’t exist.is a myth
“Understand the profitable range as an investor.”“Understand the profitable range as an investor.”
◆ BBPEA EURJPY Type-R P/L (Early 2005 – December 18, 2018) ◆◆ BBPEA EURJPY Original vs Type-R portfolio performance (Early 2005 – December 18, 2018) ◆
Now, let’s look at BBPEA EURJPY Type-R.Now, finally, let’s examine BBPEA EURJPY Original and Type-R portfolio results in detail.
The period is the same as the Original: from early 2005 to December 18, 2018.
■ P/L Curve
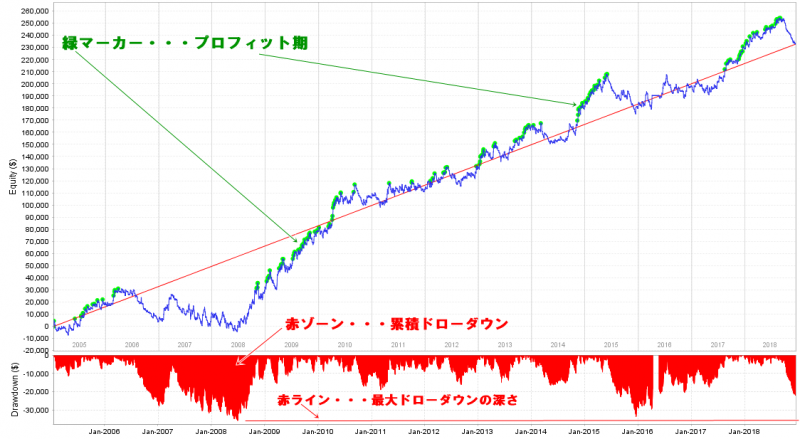
■ Type-R’s profit phase, cumulative drawdown, and maximum drawdown?
First, like Original,
- Profit phase (green marker)
- Cumulative drawdown (red zone)
- Maximum drawdown line (red line)
please look at these three, but as I explained in the Original section, follow the same points.
What’s interesting is thatthe maximum drawdown period is offset from the Original.
That’s the portfolio’s charm!
“risk is diversified, yet profits can be aggregated”
and that’s a wonderful thing.
Including two EAs in BigBangProfitFXBundle!! isn’t just to boost volume; it’s meaningful.
From a portfolio perspective of Original and Type-R, we’ll look into it in detail later, so stay tuned ^^
● Type-R’s maximum drawdown line is still far ahead

As of December 19, 2018, Type-R’s drawdown is more sluggish than Original, butthe cumulative drawdown is still early-stage, as seen in the graph.
Looking at the depth of maximum drawdown, even if drawdown continues, it seems unlikely to reach that level soon.
“Drawdown is not a big deal.”
This phrase was used in Original’s explanation as well; if you let such a drawdown scare you, you won’t be a winning trader.
■ Monthly/annual P/L table (monetary base)
BBPEA EURJPY Type-RLet’s look at its monthly and annual P/Ls.
Presented in monetary terms.
With $100k capital trading Original and Type-R,
“How much does Type-R alone earn or lose?”
is shown in the table.
■ Annual yield
Type-R outperforms Original in profitabilityhere.
Average annual return is 2.6% for Type-R, higher than Original.
Also, this yield is based on the portfolio that includes Original as a baseline.Since capital is split between the two EAs, assume each EA’s yield is about half of the overall portfolio yield.
We’ll explain the portfolio’s total performance in detail later.
■ Focusing on negatives in monthly/annual P/L

Regarding monthly P/L,there are many negative monthsas well.
This is something you must accept.
Seeing the portfolio performance this way is interesting, isn’t it?
From 2005 to mid-2008, Original dominated strongly, then Type-R caught up and by 2010 reached Original level.
After that, the duel persisted, but around 2013 Type-R grew much more than Original.
Howeverrecently Original has better results.
I’m curious to see what happens next ^^
Diversification of profits and losses between strategies is the ideal for a portfolio.
■ Monthly/annual P/L table (monetary base)
BBPEA EURJPY Original・Type-R portfolio trades, monthly and annual P/L tableLet’s examine it.
In monetary terms.
With $100k funding trading Original and Type-R,
“How much does each of the two EAs’ portfolio trades earn or lose?”
is shown here.
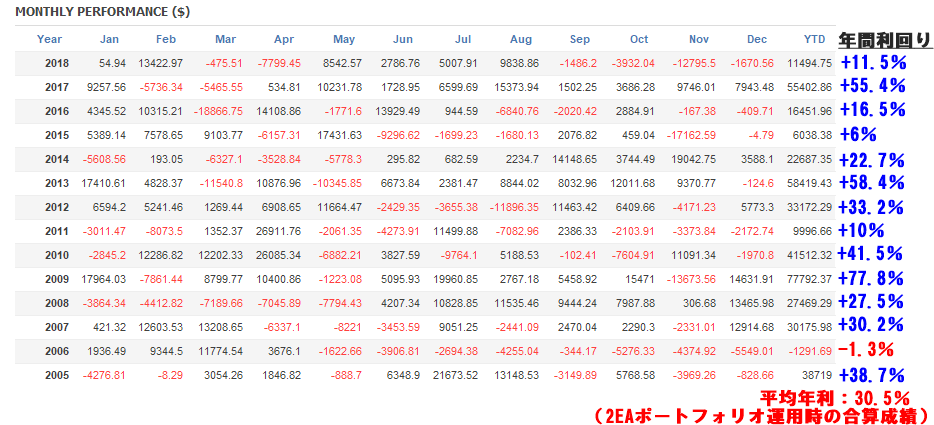
Type-R’s standalone result shows a 12.7% loss in 2006, but Original compensates and overall is
“-1.3%”
net loss.
Type-R’s maximum drawdown occurs in 2006, but Original stays strong during that period.
Original and Type-R appear well-suited together as a portfolio.
■ Annual yield
Average annual yield over 30%.
Isn’t that a dream? (lol)
If this were hedge fund performance, it would be world-class.However,

https://ryusei-fx.biz/tsumitate
◆ If you can achieve 10,000 yen monthly investments to reach 30% annual return, this is what happens ◆
The article above explains a savings approach, and we’ve simulated a similar investment for EA operation
“EA Savings Investment Simulator”
I created this.
(Thanks to Takahashi for the cooperation♪)
Now, let’s run a simple simulation using the “EA Savings Investment Simulator.”
Status for the investment model is as follows.
- Principal 300,000 yen
- Monthly 10,000 yen into the account
- Average annual yield 30%
- Investment period 14 years
- Compound interest
The 14-year period matches BBP’s verification period.
“Principal 300k yen, monthly 10k yen into the account”
This is a“mass-market level”image.
14 years of investing is a common horizon for savings-type insurance or personal pensions, so that span should be familiar.

“Principal 300k yen, monthly 10k yen into the account”
For a realistic, savings-level investment, after 4 years the account swells to 38.94 million yen.
Total contributions amount to 1.98 million yen, with actual profit around 37.93875 million yen
Monthly 10k yen contributions are more than sufficient (lol)
(Many other products are unsalvageable for lack of reproducibility)
◆ The story of returns and risks ◆

This article has become extremely long (^^;)
Thank you very much for reading until here!
Finally,
“Return and risk discussion”
I want to discuss this.
Essentially,
Increasing the lot size increases the return (profit).
However,
as return increases, risk (loss) also increases.
When considering returns, you must also consider risk.
As a risk, drawdown is assumed to be about 40%.
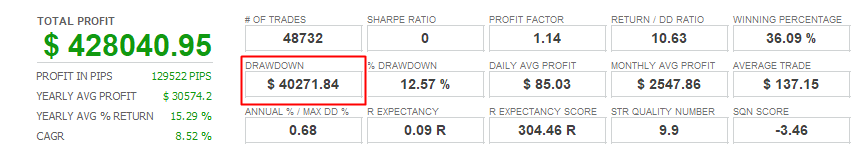
The maximum drawdown amount is $40,271, so with an initial investment of $100k, the drawdown percentage is about 40%.
If you don’t want to take that much risk, you can reduce it a bit.
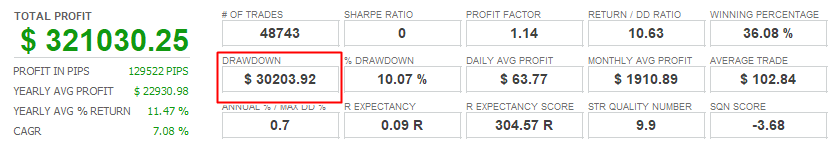
The maximum drawdown is $30,203, so with a $100k initial investment, the drawdown percentage is about 30%.
With that risk setting, the average annual yield is about 20%.
- Average annual return 30% = drawdown 40%
- Average annual return 20% = drawdown 30%
Which stance do you prefer?

◆ Conclusion ◆
This verification article has become very long, but it’s about BBPEA EURJPY Original
- BBPEA EURJPY Original
- BBPEA EURJPY Type-R
investment efficiencyin detail.FX investment realistically requires some capital to achieve substantial returns.
However, even those who can operate only with small sums should not give up.
It isn’t necessary to start with a large amount; those with limited funds can use compound growth through savings investments long-term.
that trading stance is often meaningless.If you’re spending your precious time on manual trading with such a stance, that’s a waste.
What I provide with BBP Trading hasscientific basis.
I hope you’ll examine the full scope of scientific trading in this verification article.
When I say “full scope,” there are actually more things you should know (laugh).
In another article, I explained the importance ofout-of-sample tests and walk-forward tests.
The article mentioned at the outset is below.
“Out-of-sample tests, walk-forward tests reveal EA superiority not visible in backtests”
”
https://ryusei-fx.biz/out-of-sample-test_walk-foward-test
The above article mentions that BBPEA passes out-of-sample tests and walk-forward tests, but it did not detail exactly what that entails.
The walk-forward test discussion for BBPEA’s verification was intended for this article, but it became too long, so I will cover it in a separate article.
Thank you for reading this long verification article up to this point. m(_ _)m
Both writer and reader are tired, so I’ll end it here for now (laugh).