|
Hello! This is Tejima from GogoJungle.
A special interview project where you can hear investment episodes and living know-how from active, highly skilled traders.
As always,Blacksun(Black Sun)has joined us again.
In this tough world of investing, with nearly 20 years of experience running it as a business, his analytical ability, insights and knowledge are substantial, and especiallyhis analysis using RCI is among the best in the country.
Today, we’ll reveal Blacksun’s analysis flow in detail!
Please use this to help improve your own trading skills.
|
|
|
| FX歴は約20年!RCIを極めた博識トレーダー |
|
Blacksun
GogoJungle AWARD2020 インジケーター・電子書籍部門受賞。
After graduating from the University of Tokyo's doctoral program, he pursued a research career. Even in FX, which he encountered by chance, his research spirit was ignited, and his knowledge of RCI is among the best in the country.
|
|
|
If you have not yet received the free gift from the previous first installment—the e-book by RCI researcher Blacksun—please check the password in the first video to obtain it.
Watch the first video
Now, please enjoy the interview!
|
|
The impetus for indicator development and the need for multi-timeframe analysis
|
| Blacksun, thank you for joining us again! First, please tell us about the background of developing indicators using RCI. |
|

|
| GogoNyan |
|

|
| Blacksun |
|
Nice to be here!
Based on research into RCI and price action, I developed the indicator “mBDSR” to capture trend reversals and pullbacks/retracements. |
|
| Initially, did you think you could win with just the 5-minute chart? |
|
|
|
| GogoNyan |
|
|
|
| Blacksun |
|
That's right.
When I first developed the indicator, I wondered whether simply using a single timeframe, like the 5-minute chart, could yield enough winning opportunities. |
|
| So you were saying the timing signs were good at that point? |
|
|
|
| GogoNyan |
|
|
|
| Blacksun |
|
Yes, that’s correct, but with my chart-analysis skills from 15 years ago, that alone wasn’t enough to do well.
I decided to use multi-timeframe analysis to roll down from higher timeframes to lower ones, and wait for signals from this indicator. |
|
|
Multi-timeframe analysis: practical example
|
| Please tell us how you actually proceed with multi-timeframe analysis. |
|
|
|
| GogoNyan |
|
|
|
| Blacksun |
|
There are two main types of multi-timeframe analysis
1) a coarse approach where you look at the 1-hour chart simply because there is a lower timeframe under the 4-hour chart, and 2) a detailed approach that uses RCI to solve the puzzle and determine exactly which lower timeframe to look at next. |
|
|
|
| Blacksun |
|
This detailed multi-timeframe analysis using RCI is one of the joys of using RCI, and there is a detailed explanation in the accompanying PDF, so I’ll omit further here.
For now, I’ll introduce a rough overview of multi-timeframe analysis as an example. |
|
|
|
| Blacksun |
|
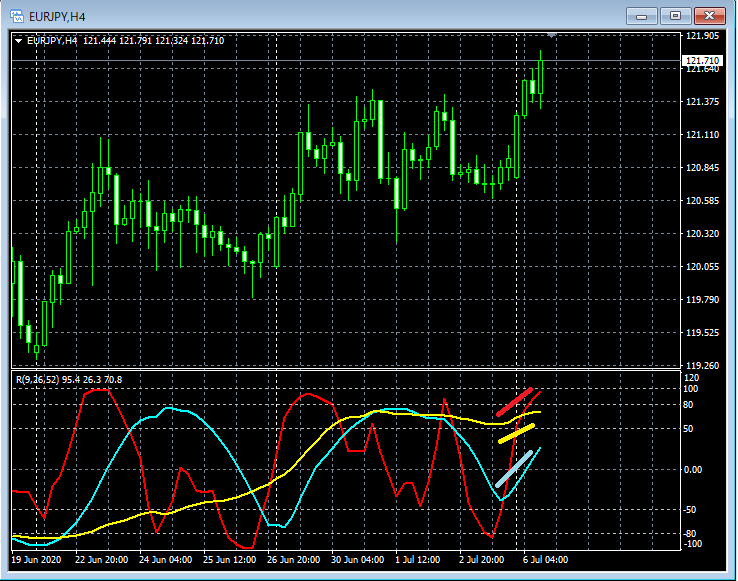
First, as the higher timeframe in this case, we look at the 4-hour chart. When we look at the 4-hour chart, the RCI is in a very strong configuration.
Because the 4-hour is in a very strong shape, it’s not unusual to target pullback buys on the lower timeframe, for example the 1-hour chart.
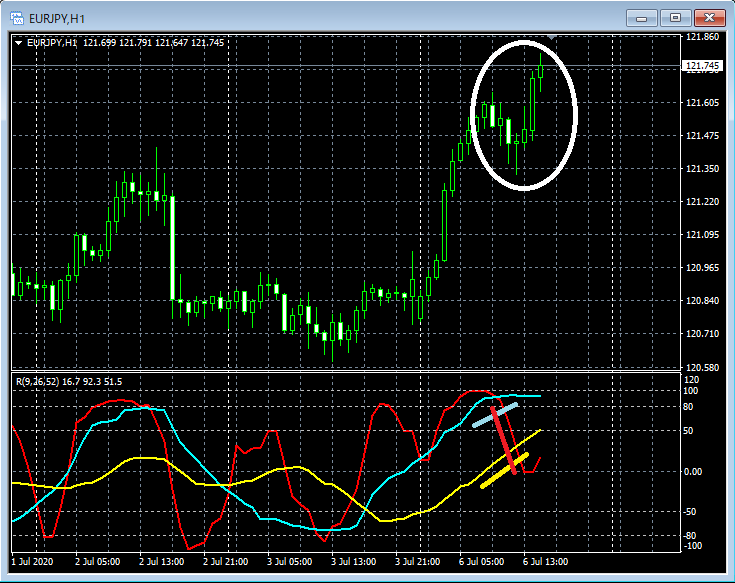
Next, when we look at the 1-hour chart, the 1-hour RCI also shows that targeting pullback buys is not unreasonable. |
|
| So you’re thinking a pullback might come on two timeframes together? |
|
|
|
| GogoNyan |
|
|
|
| Blacksun |
|
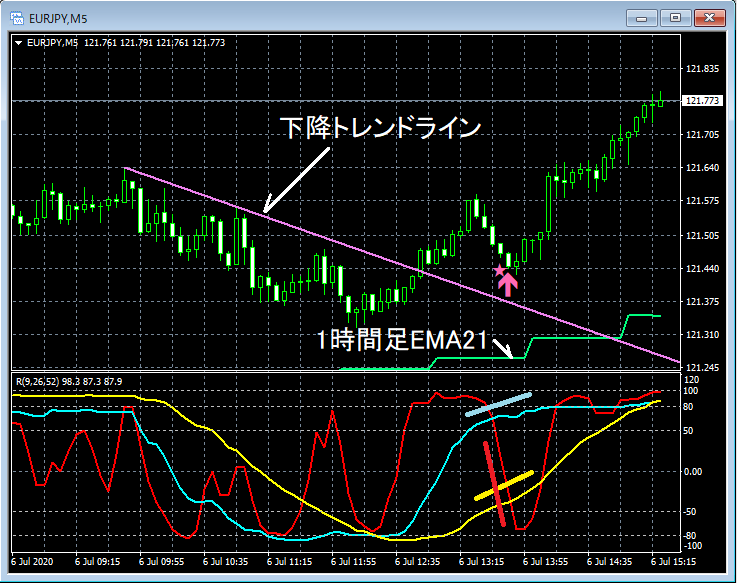
Finally, we’ll look at the 5-minute chart.
On the 5-minute chart, there is a pullback-buy setup in a downtrend, and the pullback-buy signals appear twice in timely fashion.
Prices are clearly rising in this scenario.
In this case, using a somewhat rough method from 4-hour to 5-minute, you carry it to waiting for a pullback-buy signal on the 5-minute chart; when the signal occurs, you can time the buy well. |
|
I see!
This is exactly how Blacksun analyzes using this flow.
Although this was described as a rough analysis, we now understand the flow of your analysis. |
|
|
|
| GogoNyan |
|
|
High edge = combining multiple grounds
|
| Do you have any ideas to further increase the edge? |
|
|
|
| GogoNyan |
|
|
|
| Blacksun |
|
| In refining the method, the next idea was to combine it with other common methods andtechnical tools you often see in the market. |
|
|
|
| Blacksun |
|
Let me go back a bit to the 4-hour chart
It’s not just that RCI forces a strong pattern; breaking above the recent high suggests the upside potential around here.
Next, the 1-hour chart shows that not only is the RCI setup favorable for a pullback buy, but the candles show a long lower wick pin bar indicating a bullish reversal.
These become the grounds for buying. |
|
I see! A composite technical judgement.
So we’ll look at multiple analyses as well. |
|
|
|
| GogoNyan |
|
|
|
| Blacksun |
|
| Yes. Furthermore, when you also view the final 5-minute chart, the 5-minute retraces down to roughly the 1-hour EMA21, which I regard as the most important level, before the signal lights up, and then rebounds. |
|
| Not only an RCI signal, but positions are taken based on multiple foundations. |
|
|
|
| GogoNyan |
|
|
|
| Blacksun |
|
| Yes. This allows for more reliable, high-significance trades. |
|
|
|
|
|
| GogoNyan |
|
| Second installment |
| [Comprehensive edition|Essentials of RCI analysis] A thorough explanation to boost win rate with multi-timeframe & technical methods [Special Video vol.02 / Blacksun] |
|
|
| First installment |
| 【Free e-book】Offers from overseas hedge funds?! The trading history of Japan’s leading RCI researcher【Special Video vol.01 / Blacksun】 |
|
|
|