

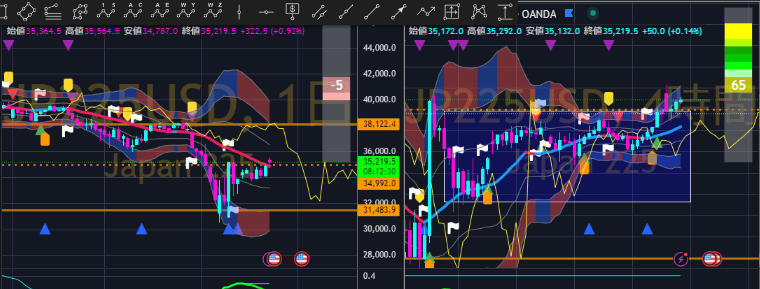
April 24 (Thu): [Bollinger Bands] Nikkei 225 vs U.S. 10-Year Treasury Yield
This time
we will compare it with the so-called “temperature of the economy.”
“US 10-year Treasury yield”
.
【Sign Tool】
In addition to the entry-point sign, we have created a trend strength meter.
I plan to keep it public for a while (*^^)v
【This Week’s Market Highlights】
This week, the movements of US 10-year yields and the Nikkei 225 are of particular interest.
All timeframes for U.S. Treasuries show a 【squeeze】 or 【horizontal channel state】, and the moment could move in any direction.
On the other hand, the Nikkei 225 is showing a flow that seems to aim for +2σ after breaking above the downward moving average, with the weekly MA battle as a point of focus. Furthermore, major U.S. indices and Bitcoin are in a corrective phase, giving the impression that the whole market is at a “turning point” toward the next trend.
In the paid section, we explain in more detail the signs of change lurking behind this 【squeeze】 market.
➥The rest is explained in detail in a members-only report.
If you are not registered yet, please click here ↓
● Use “Disassembly of the Bollinger Bands” to analyze daily charts
https://www.gogojungle.co.jp/finance/navi/series/1613?via=articles_detail_aside
● Use “The Prescription of Harmonics” to draw a “Zone where charts should stop”Zone!https://www.gogojungle.co.jp/finance/navi/series/1668?via=articles_detail_aside
(※The following is for members only.)


