
3/23 USD/JPY This week’s movement I’ve imagined fully: it’s a sell on rallies
Good morning
Through important events like the BOJ and the FOMC
In the end, from a broad perspective, it's a range market
There seems to be a tendency for USD/JPY to rise until April due to anomalies, but what do you think
After that, it will fall though…
What I'm paying attention to now
When viewed on a longer time frame
the so-called "Marr Alsago (Marr-Alargo) agreement"
The Trump administration sought to weaken the dollar to boost U.S. export competitiveness
And in the first half of this year, in order to reduce the burden of government bonds interest payments
they want to refinance into low-interest government bonds
Therefore, they seem to want to lower interest rates
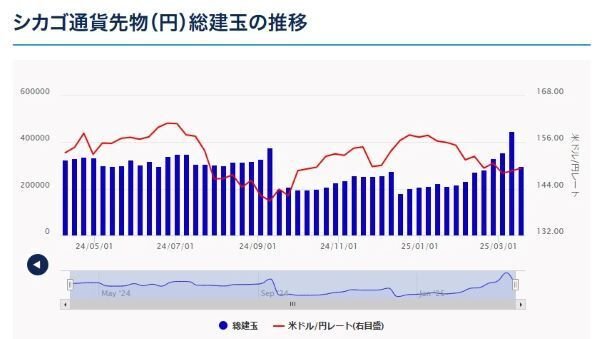
Correspondingly, speculative funds have been buying a large amount of yen
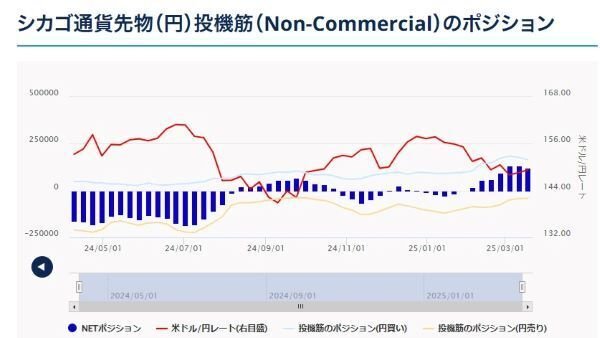
However, if that unwind occurs
the USD/JPY would rise
More and more people are pointing this out, but what do you think
Lately, is the USD/JPY buying in anticipation of that?
Whether it's really position adjustment is a bit subtle
In front of the big events BOJ and FOMC, some position adjustments have apparently been made
Yen positions are decreasing
The overall trend is lower
If there is a sharp short-term pullback, it might be good to consider selling
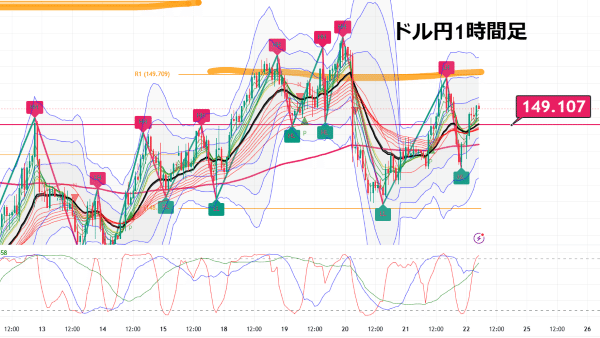
Chart analysis
USD/JPY weekly chart
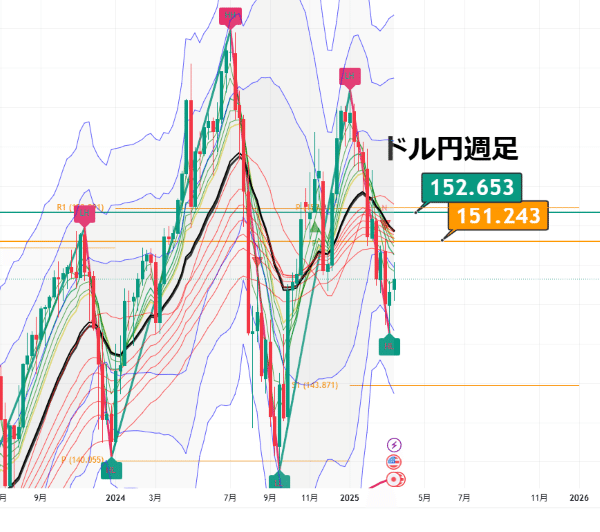
It is a rally after forming a double top and then dropping
In the recent decline, will it retrace to the orange 0.382 Fibonacci level
Green is the 0.5 retracement line
Daily chart
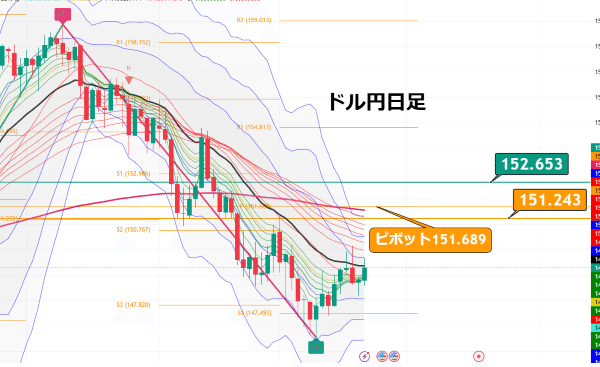
Short-term GMMA is turning upward
Bollinger bands are flattening, suggesting a range-bound market
Thin pivot lines are monthly lines for R1 and S1
A reference for position trading
Near the pivot there is a red 200-day moving average acting as a barrier
4-hour chart
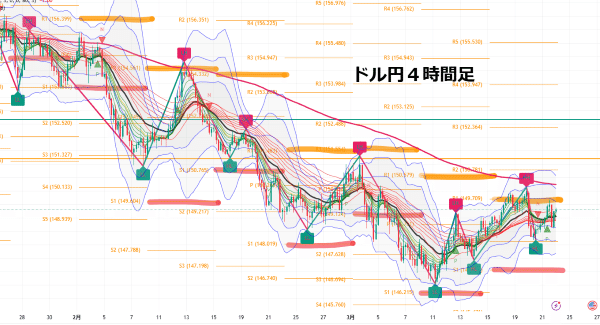
Pivot lines are weekly lines
A reference for swing trading
I marked orange and red around R1 and S1
R1 is descending, but S1 is mixed
There are moments where price reversed near these lines
It is pressured lower by the 200 MA
GMMA and 20 MA are also turning up
This week, will it break the 200 MA
Bottom-fishing long positions may be envisaged
https://www.gogojungle.co.jp/tools/ebooks/54321?via=users_products
I will show this week's pivot lines tomorrow
1-hour chart