

【BTCJPY】20181212 Daily Pivot
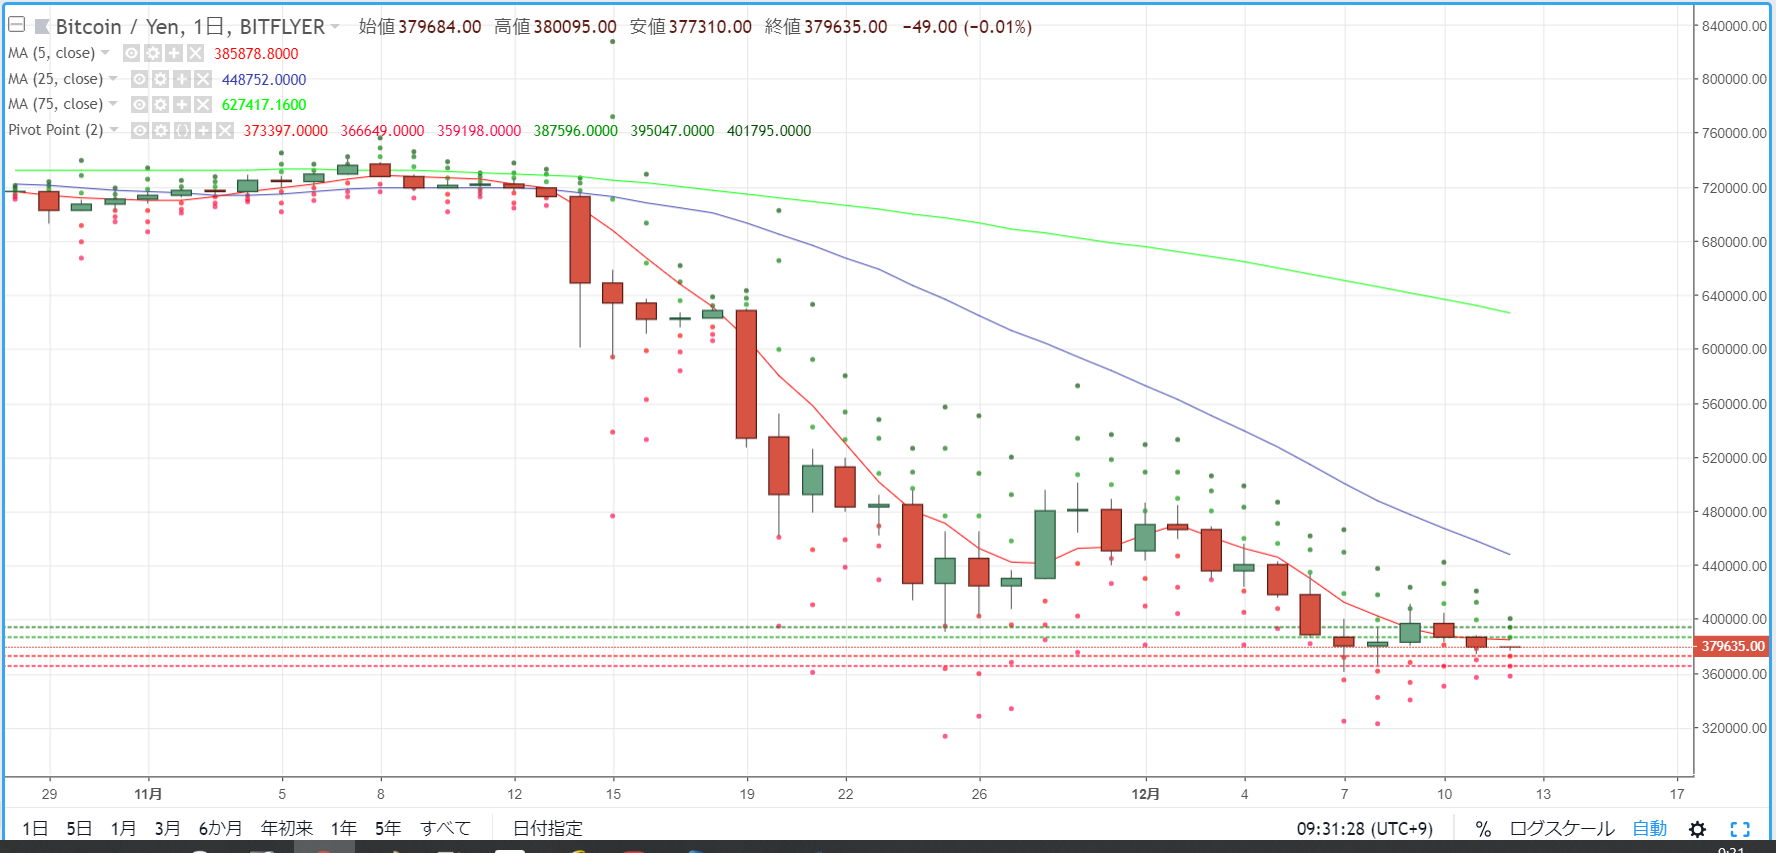
As a guideline for day trading BTCJPY, we check the pivot. Yesterday (December 11) traded in the 370,000 to 380,000 yen range and formed a bearish candlestick. The market environment was characterized by small movements within a narrow range.
R2=395,047
R1=387,596
S1=373,397
S2=366,649
※A pivot is a technical indicator that predicts the price movement range for the day based on the previous day's price action. Centered on the Pivot Point (PP), draw resistance lines (R1, R2) above and below and support lines (S1, S2) to use as trading references.
【Calculation formulas】
Pivot Point (PP) = (Previous day's close + previous day's high + previous day's low) / 3
Resistance Line 1 (R1) = PP + (PP - previous day's low)
Support Line 1 (S1) = PP - (previous day's high - PP)
Resistance Line 2 (R2) = PP + (previous day's high - previous day's low)
Support Line 2 (S2) = PP - (previous day's high - previous day's low)
(Please rewrite this section when publishing to buyers)


