
[MT5] USD/JPY Multiple timeframes mBDSR (RCI two-filter) pullback buying signal
【 master RCI!! Trend reversal, buy the dip, sell the rally】
Indicator【BODSOR・mBDSR】that shines in combination with RCI
and techniques, case studies (PDF) ★GogoJungle AWARD2020 winner★
https://www.gogojungle.co.jp/tools/indicators/11836
The PDF file includes 358 items (over 1,400 pages, over 470,000 characters in total).
At the beginning of this year, the MT5 version Beta was released!!
mBDSR(Product ID 11836)Purchase bonus】 MT5 version indicator (Beta)
“mBDSR (no filter, RCI filter, MA filter)”
https://www.gogojungle.co.jp/tools/indicators/56765
To help you use the MT5 version of mBDSR more effectively, an additional 52 PDFs (over 180 pages, over 170 chart pages, over 70,000 characters in total) have been added.
MT5 version12-hour chart is provided as standard.
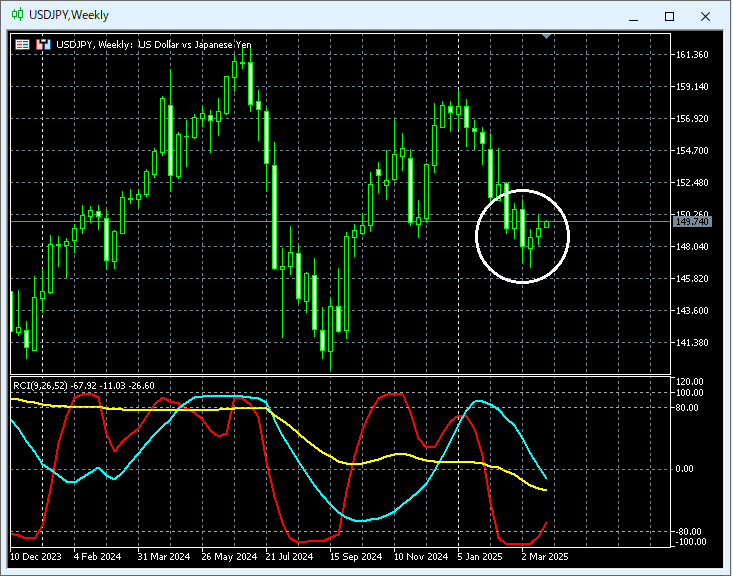
USD/JPY Weekly
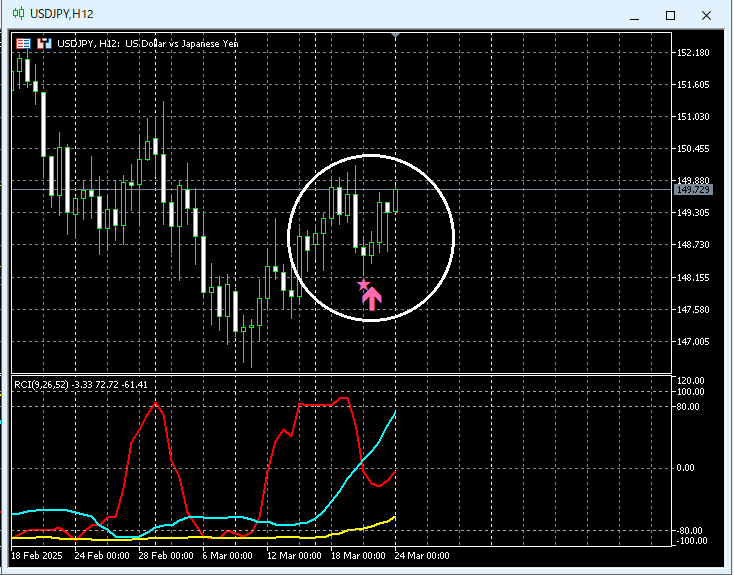
USD/JPY 12-hour
USD/JPY 30-minute
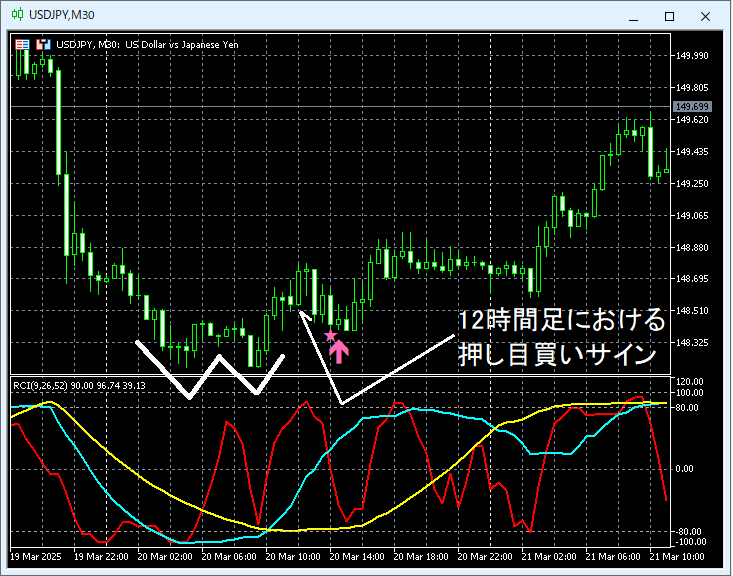
The higher time-frame situation is omitted. In order: 12-hour, 30-minutemBDSR (RCI two-filter) Buy signal lights up, and price is rising.
From this example,a trading method focusing on the three RCI lines andthe signals of mBDSR show strong compatibility.
※Please note that in the charts introduced in this article, circles, straight lines, and rectangles may be added for convenience of explanation.
Indicator that shines in combination with RCI【BODSOR・mBDSR】
and methods, case studies (PDF) ★GogoJungle AWARD2020 winner★
https://www.gogojungle.co.jp/tools/indicators/11836
The PDF file includes 358 items (over 1,400 pages, over 470,000 characters in total).
Many of them aresummarized as examples that logically link higher and lower time frames using the three-line RCI, sequentially considering multiple lower-time-frame conditions, and ultimately waiting for buy the dip or sell the rally timing (i.e., mBDSR signals) on the lower time frame..
In addition,there are many that focus on capturing points where multiple entry reasons overlap..
Also,there are methods for exploring upside and downside targets using the three-line RCI included.
In the explanation within the PDF filesmore than 1,350 charts are used.
