

【BTCJPY】20181211 Daily Pivot
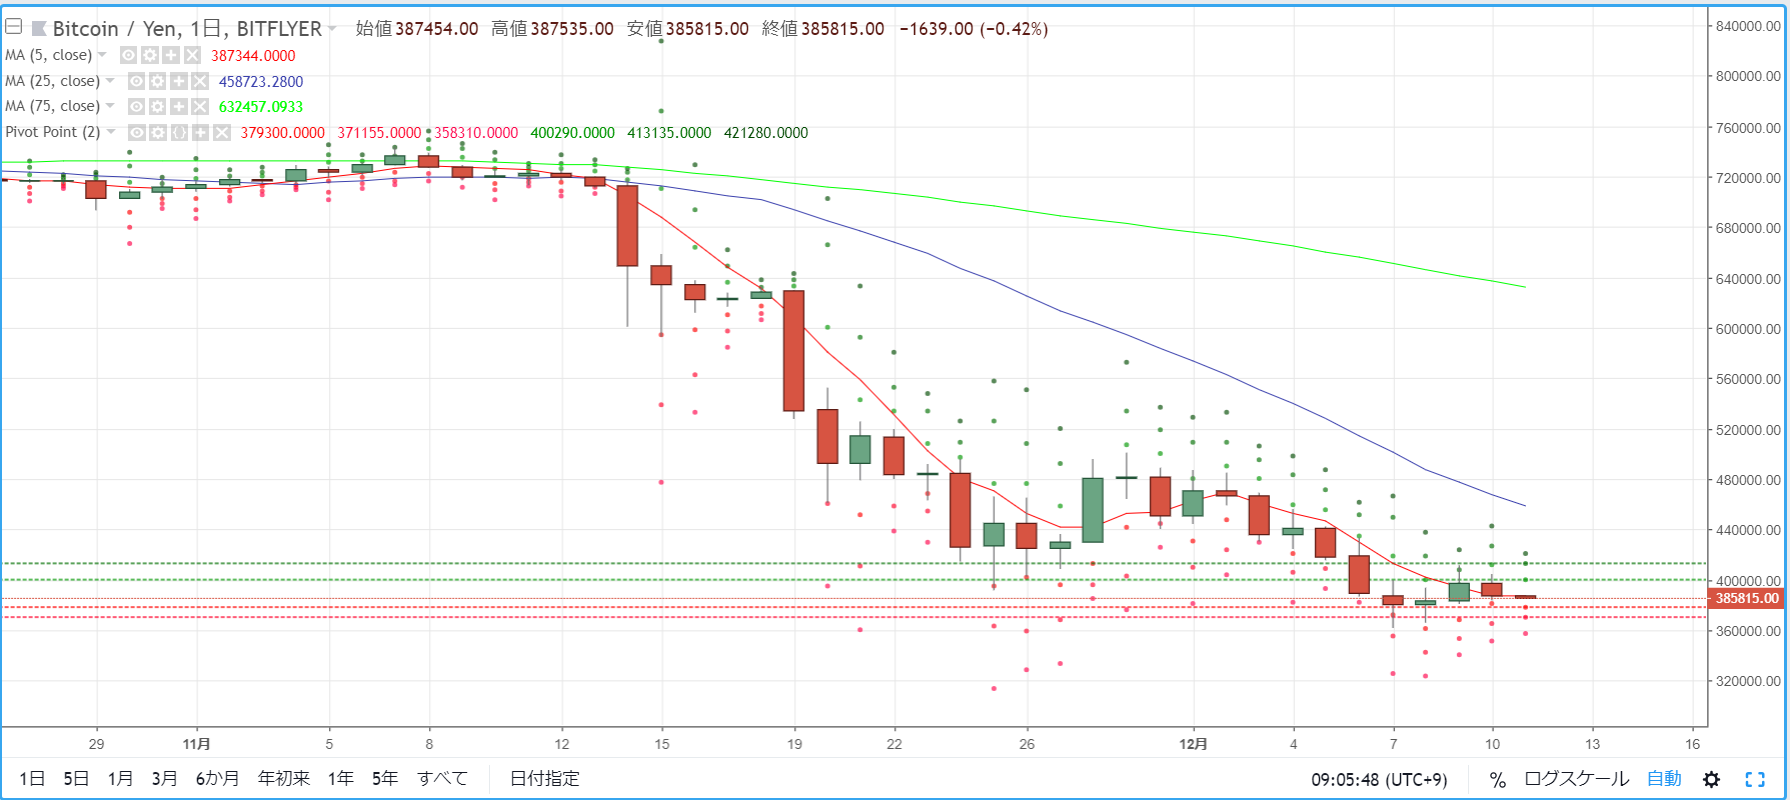
For day trading BTCJPY, we check the pivot as a guide. Yesterday (December 10) there were moments when it briefly recovered to around 400,000 yen, but the downward trend remained and it formed a bearish candlestick. The market environment closed in the upper 380,000s.
R2=413,135
R1=400,290
S1=379,300
S2=371,155
※ A pivot is a technical indicator that estimates the price movement for the day based on the previous day's price action. Centered on the Pivot Point (PP), draw resistance lines (R1, R2) above and below, and support lines (S1, S2) to use them as trading references.
【Calculation】
Pivot Point (PP) = (Previous day close + previous day high + previous day low) / 3
Resistance Line 1 (R1) = PP + (PP - previous day low)
Support Line 1 (S1) = PP - (previous day high - PP)
Resistance Line 2 (R2) = PP + (previous day high - previous day low)
Support Line 2 (S2) = PP - (previous day high - previous day low)


