

March 17 (Mon): 【Harmonic】 Nikkei 225 vs Russell 2000
This time
we will compare with the so-called “canary in the coal mine” in a bear market“Russell2000”
in comparison with it.
I have started trying the Bollinger Bands indicator.
For a while while I check its operation, I’m wondering if I can also create a harmonic indicator? I’ll try and error.
I’m not confident, but… I’ll do my best!
【Indicator in development (trial)】
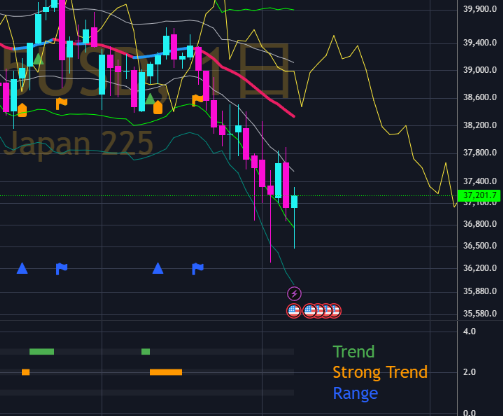
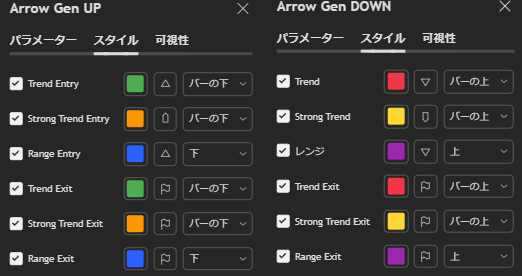
Currently, I’m creating an indicator that displays the higher timeframe signals in a sub-window.
This will allow selecting signals in the same direction as the higher timeframe.
【News】
※It’s not going very smoothly, but it is gradually taking shape.
It feels like just a little more! If you’re interested, please wait a little longer.
Since the indicator generates signals, of course there will be a delay.
Because the indicator is a “lagging indicator.”
Therefore, you may end up buying at a high or selling at a low.
But it should give you a little push in the right direction.
Please judge based on the state of the Bollinger Bands.
From there you may selectively enter,
and if signals appear after you Enter, you may hold longer.
Do not expect the signal tool alone to make you money; please understand this…
【About newsletter issues】
● Images in the newsletter crash.
● Font size and color change on their own.
These issues are occurring.
Therefore, for a while I will write without emojis or colors.
There is no change to the content, please understand…
(※Below is restricted to members。)


