What image do you imagine when you hear the U.S. employment report?
 For people who do not work in trading or finance, there may be many who do not even know the term itself.
This time
・What is the U.S. employment situation (nonfarm payrolls) statistics
・What kind of impact does it have
・How do charts move
・Can you make money?
I will explain these, so starting from “What is the U.S. employment statistics?” I think you can master the U.S. employment statistics comprehensively.
For people who do not work in trading or finance, there may be many who do not even know the term itself.
This time
・What is the U.S. employment situation (nonfarm payrolls) statistics
・What kind of impact does it have
・How do charts move
・Can you make money?
I will explain these, so starting from “What is the U.S. employment statistics?” I think you can master the U.S. employment statistics comprehensively.What is the U.S. Employment Statistics in the first place?
The U.S. employment statistics can be simply described as an “American economic indicator” released every month. To explain in a bit more detail, it is an economic indicator surveyed by the U.S. Department of Labor, released on the first Friday of every month, covering data from businesses and government, including ・ Nonfarm payrolls ・ Unemployment rate ・ Construction employment ・ Manufacturing employment ・ Retail employment ・ Financial sector employment ・ Weekly hours ・ Average hourly earnings and more, spanning around ten or so items. Among these, the ones that traders in FX or stock are paying attention to are ・ Nonfarm payrolls ・ Unemployment rate ・ Average hourly earnings Note: Employment statistics are not only for the United States but are announced in various countries such as Australia and Canada. Although I’ve explained what the U.S. employment statistics are, for people who don’t engage in investing, there are probably more who think, “Isn’t this just an economic indicator? What exactly is an economic indicator?” Like the U.S. employment statistics, indicators called “economic indicators” from various countries are released every day or month, and famous ones include ・ U.S. employment statistics ・ Consumer Confidence Index ・ ISM Manufacturing Index ・ FOMC Why are these economic indicators important? Because these indicators quantify various aspects of a country’s economy, so investors decide whether to buy or sell stocks and currencies by looking at them. Since they guide investors’ decisions, they become the basis for capital flows and thus where stocks or currencies move. In stock and currency trading, buying at a low price and selling at a high price yields a profit from the price difference, so when economic indicators signal things are “doing well,” traders buy currencies or stocks to seek profits. Among them, the “U.S. Employment Statistics” is the world’s leading economic indicator, reflecting the U.S. employment situation, and it has a huge influence on the world economy in the future. In very simple terms, what it means is ・If U.S. employment increases → U.S. economy improves → world economy improves ・If U.S. employment decreases → U.S. economy worsens → world economy worsens Note: As mentioned later, not everything will happen exactly as this. There may be unfamiliar terms flying around, but as long as you understand that “U.S. economic data affects economies around the world,” you’ll be fine.Three indicators to pay special attention to within the U.S. Employment Statistics
Among the U.S. employment statistics, the particularly important indicators are ・ Nonfarm payrolls ・ Unemployment rate ・ Average hourly earnings and I will take a closer look at these. Nonfarm payrolls is the most watched indicator within the U.S. employment statistics, showing the change in employment excluding farming and self-employed individuals. It’s a key metric showing how many workers have increased or decreased, so the numbers come out as breaking news. Next, slightly less attention but still important is the unemployment rate. The unemployment rate targets people aged 16 and over, and it indicates how many workers who support the U.S. economy are decreasing. For example, even if nonfarm payrolls increase, if the unemployment rate falls, prices may fall. Finally, “average hourly earnings.” This indicator became noteworthy when Janet Yellen took office as Fed Chair. Simply comparing employment numbers and unemployment rate won’t reveal the core issue if average earnings are not rising, so this metric is essential to gauge wage conditions.What happens when the U.S. Employment Statistics are released?
The pure impact of the U.S. Employment Statistics is roughly: ・ Last month’s employment numbers were weak → implement economic measures ・ Last month’s numbers were strong → tighten the economy ・ Depending on the result, decide whether to raise interest rates or tighten, etc. In trading communities, this is often described as a festival. What is the “festival” in the trading world? Because it is the most watched economic indicator in the currency market, hedge funds, institutions, and individual investors congregate, moving prices dramatically, hence the “festival” analogy.
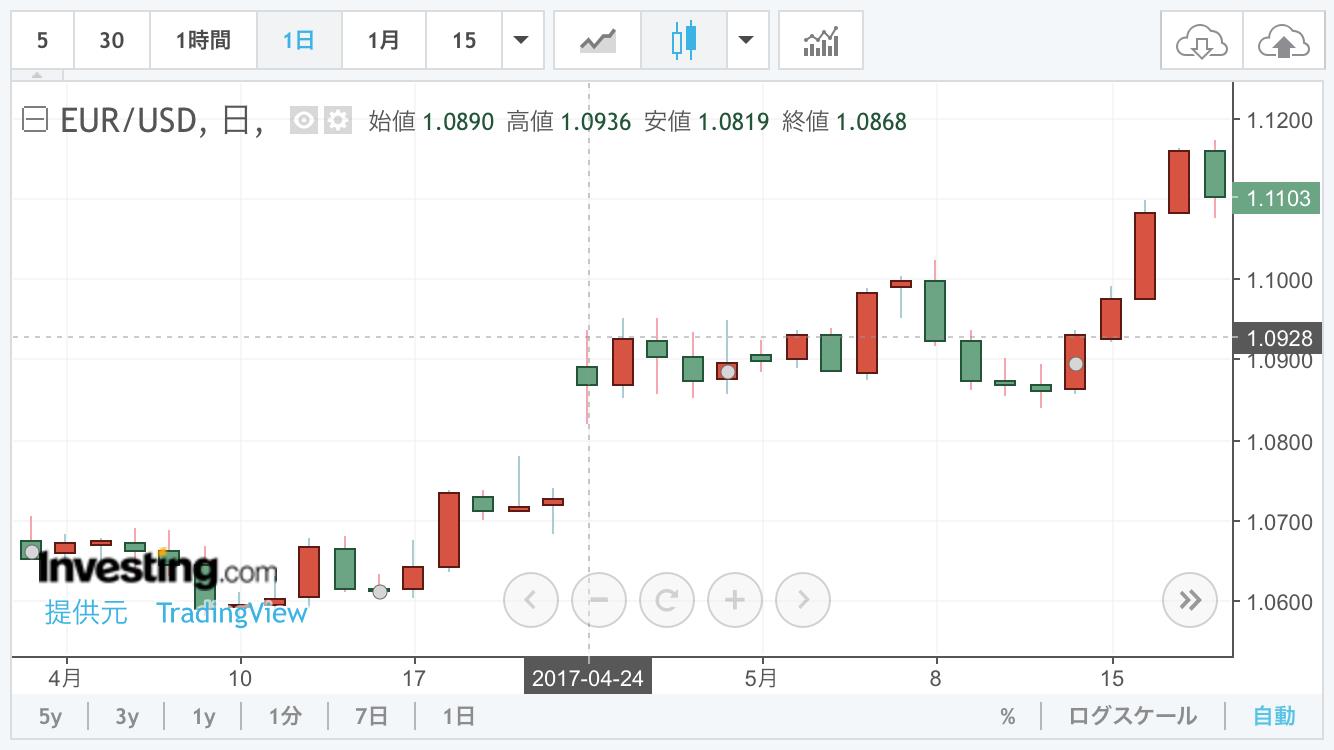
How does the chart move when the U.S. Employment Statistics are released?
When the U.S. Employment Statistics are released, the chart moves in two main ways: ・ It moves strongly in one direction right after the release and then retraces ・ It moves strongly in one direction right after the release and continues in that direction further There are two patterns. In USD/JPY, a daily movement of 50 pips is considered large, but immediately after the release results can move 100 pips or more. Pips are the smallest unit in FX. Thus, it often breaks through the range that existed before the release and shifts price up or down significantly. However, if the result is lukewarm, price movement will be larger than usual but may not break the previous range; prices can revert before or at the release. Movements also can bounce off moving averages, etc., so this is a good gauge of whether the market is treating the data as more or less significant than the numbers indicate. In the short term, these price movements occur as described, but in the long term, they can indicate a trend reversal, ・ Before the U.S. Employment Statistics: uptrend → after: downtrend ・ Before the U.S. Employment Statistics: downtrend → after: uptrend So the numbers themselves have a significant impact on future markets.The relationship between pre-release expectations and U.S. Employment Statistics
The numbers of the U.S. Employment Statistics are forecast by various institutions and individuals, and you can see forecasts a few days in advance on media and social networks. There is a market adage, “Buy the rumor, sell the fact.” Around the time forecasts are announced, ・ Positive news → rise ・ Negative news → fall And even if the actual result doesn’t match expectations, the market can move over a week or two. Since traders trade on rumors, if the results differ from expectations, a tremendous reversal can occur, so be careful. Conversely, if results are nearly as forecast, the market may not react strongly, and investors who expected large moves may call the results disappointing.Does the U.S. Employment Statistics influence monetary policy and the world economy?
So far we focused on how the chart moves after the statistics, but now let’s look at how it affects U.S. monetary policy. In the U.S., there is an institution similar to Japan’s central bank called the Federal Reserve (Fed), and it uses the employment statistics results to decide whether to raise rates. Generally, raising interest rates tightens the economy, while lowering rates eases it, so: ・ Positive results → consider rate hikes ・ Negative results → delay or avoid rate hikes Such decisions have occurred in the past. Even if the employment statistics are weak, rate hikes can be pursued temporarily due to weather-related factors, so it is not solely determined by the statistics, but the indicator remains one of the factors. Given that the U.S. economy leads the world, its influence on the global economy is significant. Some may wonder whether China’s economic indicators are also important. However, China has faced issues with data manipulation in the past, and trust in its indicators remains comparatively lower. Thus, while China is a major economy, the U.S. indicators are still considered the most important.Is the U.S. Employment Statistics profitable?!
So far we’ve discussed what the U.S. Employment Statistics are, but is it profitable? I’d like to talk about that. The Internet has many people aiming for quick riches with U.S. employment statistics, so what is the reality?A quick recap of FX knowledge
Before examining trading around the U.S. Employment Statistics, I’ll do a quick FX knowledge refresher. To explain whether you can profit from the “festival” of the U.S. Employment Statistics, you need to understand FX basics. If you understand the mechanism, you’ll know the “why.” FX works by “buying one currency with another.” In simple terms: ・ Buy low and sell high → profit ・ Sell high and buy back low → profit A key point is that you can initiate a sale (short) in FX, which is not always the case in stocks. So you can profit from whether the price goes up or down by predicting the direction. FX also features leverage, allowing trades larger than your capital: ・ Domestic up to 25x ・ Overseas up to 1000x, etc. This increases the risk. With 1000x leverage, depositing 10,000 yen could enable trading in the millions. Therefore, you can profit whether the chart goes up or down, and you can trade beyond your own funds.Forecast trades for the U.S. Employment Statistics
From what we’ve seen, you might think, “The Employment Statistics must be highly profitable!” but that is not necessarily true. The reason is that forecasting the U.S. Employment Statistics is extremely difficult. Forecasts appear across various media, but some are accurate and some are wildly off. As mentioned, FX involves leverage, so a single loss can be devastating. If analysts’ forecasts turn out to be extremely wrong, many investors terminate their involvement in the market. Also, after the release, even if profits appear for about an hour, some wake up to a loss at the next morning’s close. So, because it’s an economic indicator, assuming “prices will move in a certain way because of the result” is dangerous.If you can’t predict the price, why not trade without prediction?
Some clever people think: because movement is highly volatile, “place buy and sell orders 20–30 pips away from the current price,” and lock in profits if one side hits. This approach creates a condition where “either way the price moves, you profit,” but during the U.S. Employment Statistics release, spreads widen abnormally and orders can fail, making it very risky. In the worst case, both orders hit and you get stopped out on both sides, leaving you with a major loss for the following month. Sure, it looks attractive to beginners, but monthly trading with compounding is difficult, and one big loss can be catastrophic, so it’s wise not to try it.Summary
How was it? We discussed the U.S. Employment Statistics. It is clear that this is an extremely important U.S. economic indicator with a large impact on the economy thereafter. While reading long-term trends is an “extremely important” factor in trading, short-term trading is not advisable, so be careful not to act impulsively.◇ For those who want to start FX, click here ↓
What is FX
◇ Open an FX account here ↓
Trio Auto FX
Money Partners FX
Monex FX
Central Tanshi FX
◇ For those who want to start cryptocurrency, click here ↓
How to start with cryptocurrency
Articles about U.S. Employment Statistics
(Please rewrite this part for public release)
× ![]()